
1: Trees are now showing as polluting entities. They do not appear when the trees are not absorbing pollution. The trees are still correctly absorbing pollution, and pollution still spreads as expected.
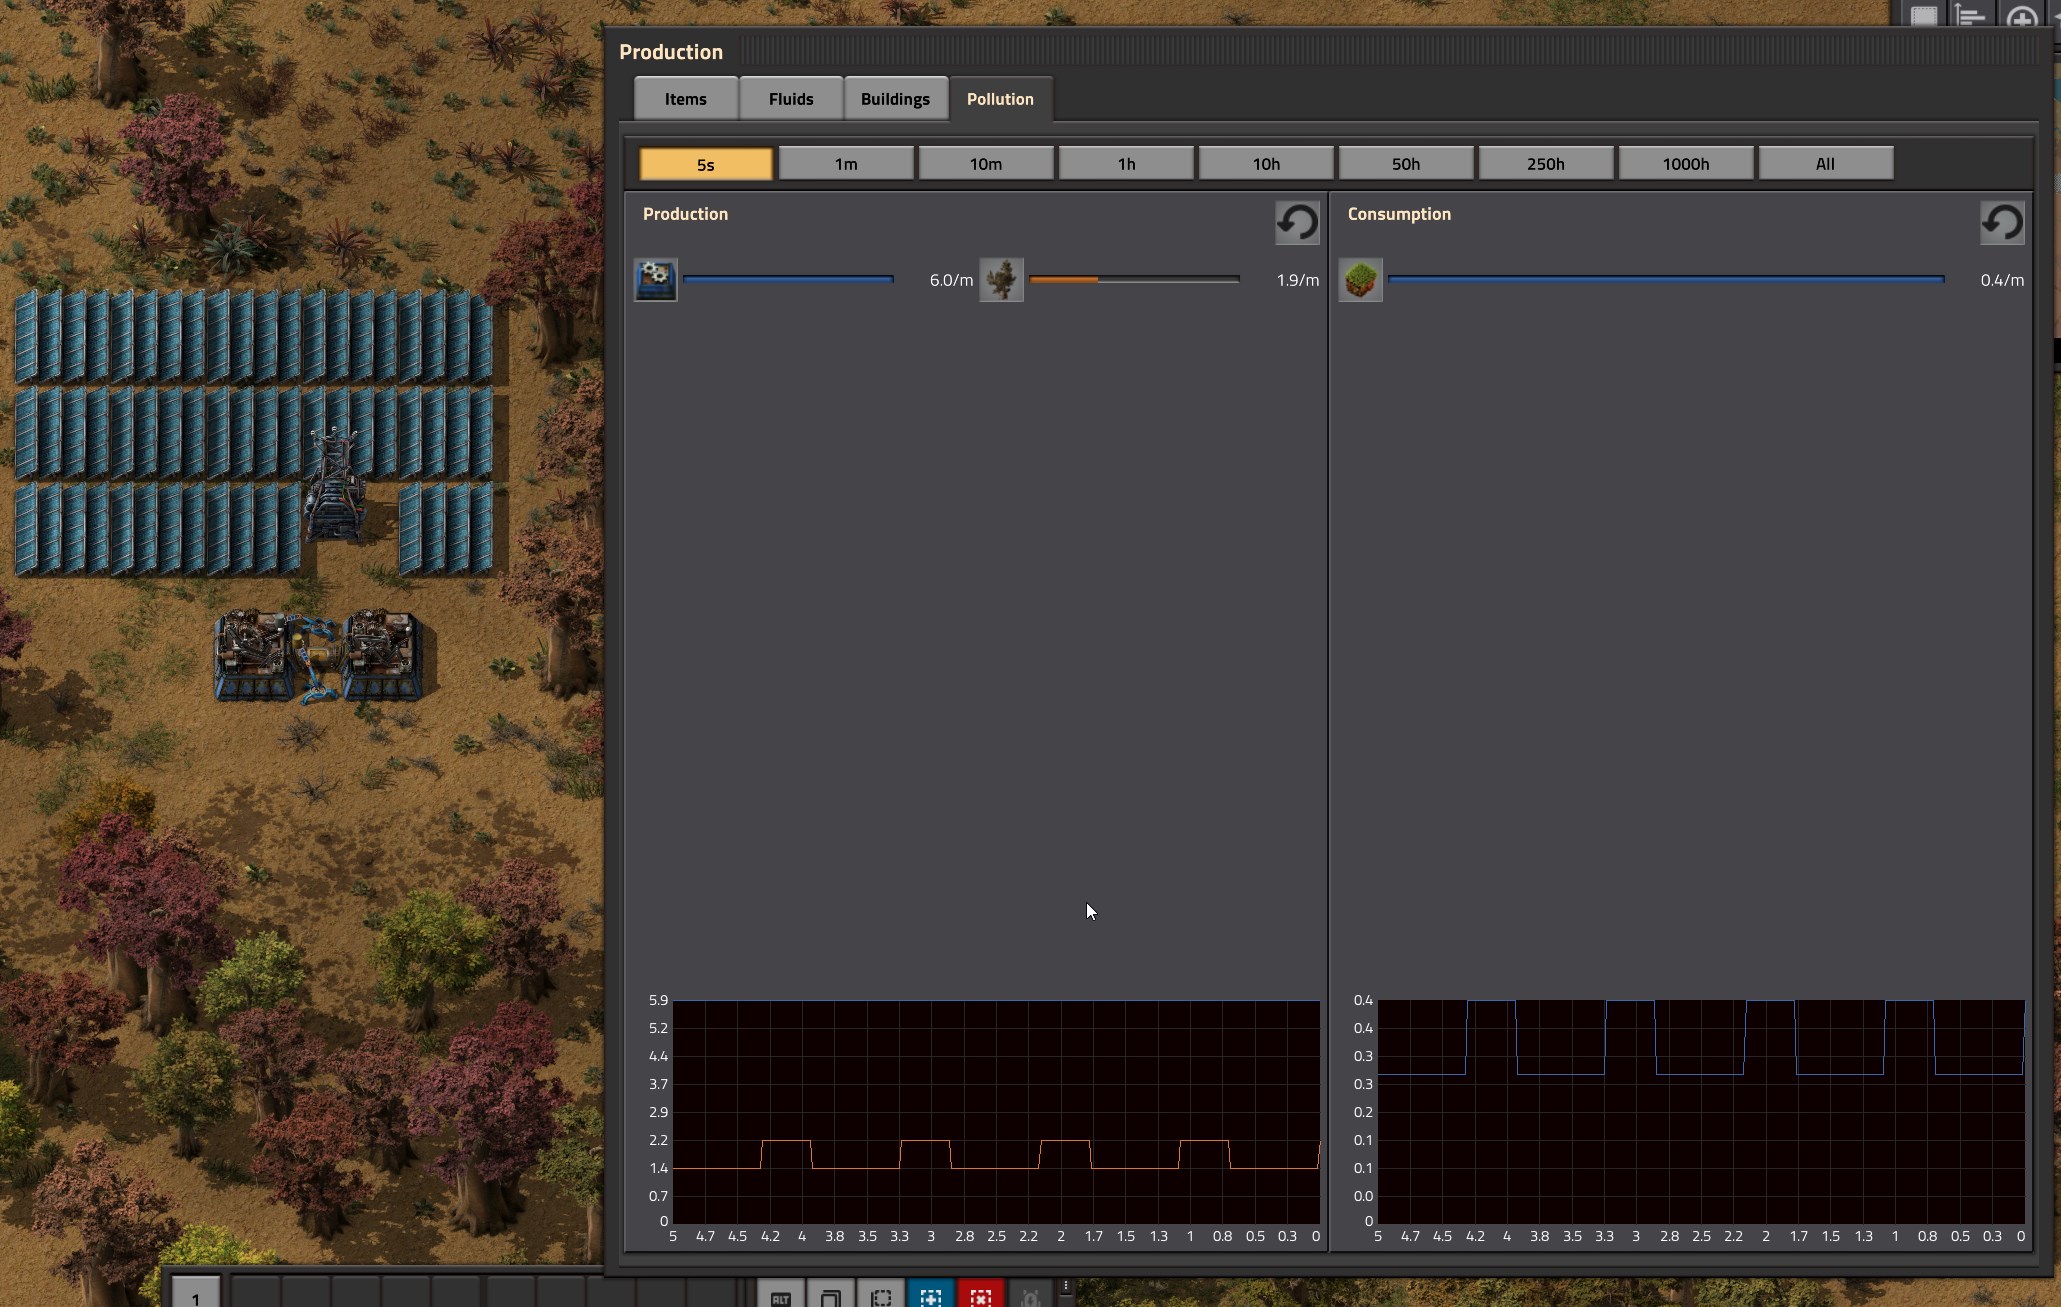

Only the statistics are wrong, they consume pollution just like they should.boran_blok wrote: Tue Apr 09, 2019 8:33 pm Just a question, is this just a visual bug (meaning, is this reported wrong) or do trees actually generate pollution?


The number on the icon on the pollution stats is the number of producers creating the pollution. (X assemblers, Y refineries, etc.)sawbladex wrote: Wed Apr 10, 2019 12:36 am Question, what is there an exact meaning for the number right by the icon for each entity type?
For the production/kill/build stats, it's pretty clear that it is the floored amount of items produced/consumed/killed/etc.
But for the pollution screen, it is not clear.

Wrong, on the pollutions screen, it's the number of pollution units created/consumed within the selected time frame, just as for the other screens in production stats.MasterBuilder wrote: Wed Apr 10, 2019 3:33 amThe number on the icon on the pollution stats is the number of producers creating the pollution. (X assemblers, Y refineries, etc.)sawbladex wrote: Wed Apr 10, 2019 12:36 am Question, what is there an exact meaning for the number right by the icon for each entity type?
For the production/kill/build stats, it's pretty clear that it is the floored amount of items produced/consumed/killed/etc.
But for the pollution screen, it is not clear.
The "x/m" on the right is the amount of pollution being produced.
Same as the other stat screens.

