TL;DR
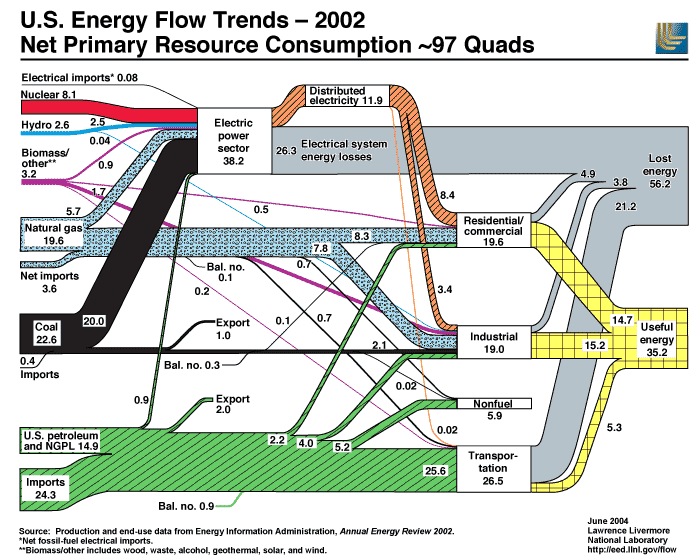
Flow graphs are really cool. I would like to be able to see my item / liquid / electricity production using flow graphs.
What ?
I suggest adding flow graphs (see image) as a means to track production and consumption of items, liquids, electricity.This could be in a tab of the production view.
I couldn't find similar suggestions in the Frequently Suggested / Link Collections or More Game Information (Statistics, Monitoring, Graphs)
Why ?
It just looks really cool.More seriously, these graphs are a great way of conveying information. It would be particularly great for Factorio. The picture says it all.
I love the current line charts in the production view. They do a great job of showing the player how their production / consumption evolves over time. It works great over the the last few minutes, or over the last dozen hours.
However, I find it difficult to see the relation between the production of items. It's great to know that my factory produces xxx thousands of item Y per minute - But that's not very useful information in relation to the entire rest of the factory. It would be great to know how those items are being used. Flow graphs would do a great job of showing that information to the player. Flow graphs give a visceral understanding of "what is going where", with how thick the branches are. At a glance, you can see how many belts are used for splitters vs undergrounds vs science packs.
Having one massive graph representing every single item would look amazing, but would be too cluttered to be useful. There needs to be some thought put into making flow graphs adapted and useful for Factorio.
Here are some thoughts:
- For every item, there could be a mini-flow graph
- You would see the ingredients used for producing it on the left, and the items it's used for on the right.
- You could click on an item on either side to see that item's mini-flow graph. This would be similar to how the science tech tree works.
These are some first ideas, which can certainly be improved on. Please suggest your own!
I'm surprised no one has talked about flow graphs already (AFAIK). Flow graphs are too cool an idea not to share!
Is anyone else as enthusiastic about flow graphs as I am?

