Smooth graph in electrical network info and production statistics

Post your ideas and suggestions how to improve the game.

Moderator: ickputzdirwech

Post Reply
mrvn
Smart Inserter
Smart Inserter
Posts: 5709
Joined: Mon Sep 05, 2016 9:10 am
Contact:

Smooth graph in electrical network info and production statistics

Post by mrvn »

TL;DR
Add an option to the graphs in electrical network info and production statistics to make the lines smoother.
What ?
Add a slider "Smoothing: N" to the GUI. If one pixel in the graph covers 10 seconds then the value of each pixel is the avergage of the 10 * N seconds before the pixel. Depending on N this will smooth out spikes and make for a much more readable graph.

Note: Values for pixels will overlap by N-1. The value of the next pixel can be calculated with minimal overhead by adding (current value - value N-1 steps ago) / N. So regardless of N the cost of computing values will remain constant.
Why ?
With the way back-pressure works to stop assemblers there is a constant stop and go action depending on the ratios of buildings and speed of recipes. It's rare that anything has a constant consumption or production. Even increasing the time span of the graph so each pixel represents a longer timeframe doesn't get rid of the spikeyness of the graph. Some of it because there are longer duration spikes, like when a train is loaded and all the ore miners start up till the buffer chests are full again. So short term spikes get replaced by long term spikes.

Currently the graph can look like this:
graph.png
graph.png (31.99 KiB) Viewed 2041 times
With the lines overlapping and spiking like this they become unreadable. A smooth out line for each item in the graph would reduce the clutter and make it more useful.
Alternatives?
Instead of calculating a value for every pixel only compute those pixels that are labeled on the X axis and connect them with a dot.

Instead of drawing the value at time X draw the average from X to now. So the 1m graph would have the 60s average on the left, the 30s average in the middle and the current value on the right.
Last edited by mrvn on Sun Oct 24, 2021 6:38 pm, edited 1 time in total.

mmmPI
Smart Inserter
Smart Inserter
Posts: 2747
Joined: Mon Jun 20, 2016 6:10 pm
Contact:

Re: Smooth graph in electrical network info and production statistics

Post by mmmPI »

mrvn wrote:
Sun Oct 24, 2021 5:15 pm
With the lines overlapping and spiking like this they become unreadable. A smooth out line for each item in the graph would reduce the clutter and make it more useful.
You can select one or several item and then the graph only shows them.

but i agree with you it would be interesting to have better visual information.

Not sure i understand your proposition however making the line smoother and reducing the spikes is not desirable in my eyes, i think the tab should reflect as accurate as possible what is happening.

Then having options to interpret such as average, trend, +/- total production , and so on i'm favourable.

mrvn
Smart Inserter
Smart Inserter
Posts: 5709
Joined: Mon Sep 05, 2016 9:10 am
Contact:

Re: Smooth graph in electrical network info and production statistics

Post by mrvn »

mmmPI wrote:
Sun Oct 24, 2021 5:43 pm
mrvn wrote:
Sun Oct 24, 2021 5:15 pm
With the lines overlapping and spiking like this they become unreadable. A smooth out line for each item in the graph would reduce the clutter and make it more useful.
You can select one or several item and then the graph only shows them.

but i agree with you it would be interesting to have better visual information.

Not sure i understand your proposition however making the line smoother and reducing the spikes is not desirable in my eyes, i think the tab should reflect as accurate as possible what is happening.

Then having options to interpret such as average, trend, +/- total production , and so on i'm favourable.
It would be selectable. Set N=1 (default) and you get the current graph. N=2 and each pixel is averaged with the previous value. The higher you select N the more smoothed out it is.

For me in the 1m view each pixel represents 0.2s or 12 ticks. So N=2 would show a 24 ticks average. N=5 would give 1s averages. Just now I have a case where a pretty power hungry electrolyser runs once per second. So I would want a fairly big N to smooth that. Unless I'm looking to see if anything stutters. That's why it needs to be a slider so you can easily set a value that works for you.

mmmPI
Smart Inserter
Smart Inserter
Posts: 2747
Joined: Mon Jun 20, 2016 6:10 pm
Contact:

Re: Smooth graph in electrical network info and production statistics

Post by mmmPI »

You can already read the power consumption of the 1 electrolyser if you select its icon under the power graph, it will show only its graph, and also on the table under the graph read the averaged value for last 5 sec 30 sec 1 minutes 10 minutes 1 hour and so on.

If it's impossible to distinguish because you use many eletrolysers of the same tier, you need to isolate a few on a power grid ( with solar for example). It will be easier to read their cycle.

What you want is that the graph offer the possibility to reflects a curve of the different averages on a period of N times ? instead of trying to represent consumption in real time ?

mrvn
Smart Inserter
Smart Inserter
Posts: 5709
Joined: Mon Sep 05, 2016 9:10 am
Contact:

Re: Smooth graph in electrical network info and production statistics

Post by mrvn »

I know that. But that is just the average over the whole time of the graph. One value. And if you have items close together they randomly switch positions and can be very hard to read and compare.

Try reading 2 or three numbers at the bottom at the same time? You basically have to make a screenshot or pause the game (which you can't in multiplayer). Comparing the number of X with that of Y 5 seconds ago like you can in a graph? Forget it.

User avatar
ssilk
Global Moderator
Global Moderator
Posts: 12888
Joined: Tue Apr 16, 2013 10:35 pm
Contact:

Re: Smooth graph in electrical network info and production statistics

Post by ssilk »

The only thing I could add here is
A) Factorio is not though for that, far beyond of what’s needed in vanilla.
B) the stats had been always a source for criticism.
C) there is the Graftorio mod https://mods.factorio.com/mod/graftorio2 which I can recommend to exactly produce those graphs and much more. It has of course the disadvantage of needing some CPU and it takes some time to configure it for your needs.
Cool suggestion: Eatable MOUSE-pointers.
Have you used the Advanced Search today?
Need help, question? FAQ - Wiki - Forum help
I still like small signatures...

mmmPI
Smart Inserter
Smart Inserter
Posts: 2747
Joined: Mon Jun 20, 2016 6:10 pm
Contact:

Re: Smooth graph in electrical network info and production statistics

Post by mmmPI »

mrvn wrote:
Mon Oct 25, 2021 12:11 am
I know that. But that is just the average over the whole time of the graph. One value. And if you have items close together they randomly switch positions and can be very hard to read and compare.

Try reading 2 or three numbers at the bottom at the same time? You basically have to make a screenshot or pause the game (which you can't in multiplayer). Comparing the number of X with that of Y 5 seconds ago like you can in a graph? Forget it.
haaa you have to select the longer tab "250H" usually those are not jumping items, even the last 2 or 3 numbers at the bottom. Select the 3 desired machine and then switcback to the 5 second graph. You have only 3 graph visible, go to 10 minutes ,same, you have the average value written for each interval at the bottom and a spiky graph to help you realise what was averaged to give you the value.

UkcsAlias
Inserter
Inserter
Posts: 22
Joined: Mon Oct 04, 2021 11:07 am
Contact:

Re: Smooth graph in electrical network info and production statistics

Post by UkcsAlias »

ssilk wrote:
Mon Oct 25, 2021 7:29 am
A) Factorio is not though for that, far beyond of what’s needed in vanilla.
The only issue i see is that for long durations, rather than taking a static point, you are going to take a bigger set of data to calculate, which adds load.

But even here you can use keyframes for statistics. Each keyframe then can just take a certain value for each stat (average, max, min). The longer the graph, the more of those keyframes get averaged out (the 10min marker could have 4 keyframe values). It doesnt matter that the graph doesnt update every second at that point as thats not realy what you are looking for.

Base, peak and average load are all 3 a statistic that generaly are relavent to diagnose certain issues (lack of power during peaks can be buffered, for which the average might be interesting to get an idea of required buffer size. And the lowest gives a good identification of minimum load you will always consume). On large bases power can fluctuate a lot. And if you can isolate sections (which with power switches you can), you can gather some info about general load for each section. Which in turn can be used for some logic you can apply.

Sure, it might not be an optimal way to handle issues or monitor your factory. But its still a way that can aid to plenty of playstyles because it doesnt require perfect calculations. Especialy the casual player might want to get such info because of that.
But in the end, if it adds too much load, its going to be a bad idea anyway. This to me remains the most important aspect. The casual player might like such stats, the huge base builders might find the load it adds a major issue.

And maybe this is something that can be added in an expansion. Because who knows what will be added then? Do note that satisfactory relies quite a bit on the power graph while in that game factories are generaly more reliable at power usage because you can sink items (and therefor factories keep running). But then again, thats a game where instead of brownouts that slowly increase the problem, it instantly blacks out, which is a lot more harsh than this game.

I would say its something worthy enough to investigate for potential low cost solutions. But then again, im not a gigabase builder, so i am biased on that.

mrvn
Smart Inserter
Smart Inserter
Posts: 5709
Joined: Mon Sep 05, 2016 9:10 am
Contact:

Re: Smooth graph in electrical network info and production statistics

Post by mrvn »

UkcsAlias wrote:
Mon Oct 25, 2021 5:44 pm
The only issue i see is that for long durations, rather than taking a static point, you are going to take a bigger set of data to calculate, which adds load.
You aren't. You don't add up all the data points that go into each pixel. Instead it's a sliding window. As the graph advances the data point from "T-N" is subtracted and the data point for "T" is added. All the data points in between are carried over.

So for N > 1 the computation becomes twice as expensive but it's always the same no matter what N is except for a startup cost for the first pixel. That happens once and then the graph scrolls and only does one add and sub and a division per pixel scrolled.

User avatar
ssilk
Global Moderator
Global Moderator
Posts: 12888
Joined: Tue Apr 16, 2013 10:35 pm
Contact:

Re: Smooth graph in electrical network info and production statistics

Post by ssilk »

Using keyframes: yes, would be useful.

In general, if I had the knowledge of programming c++ I would completely rewrite the stats. 8-) :lol: :twisted:
Because they lack on so many edges. :cry:

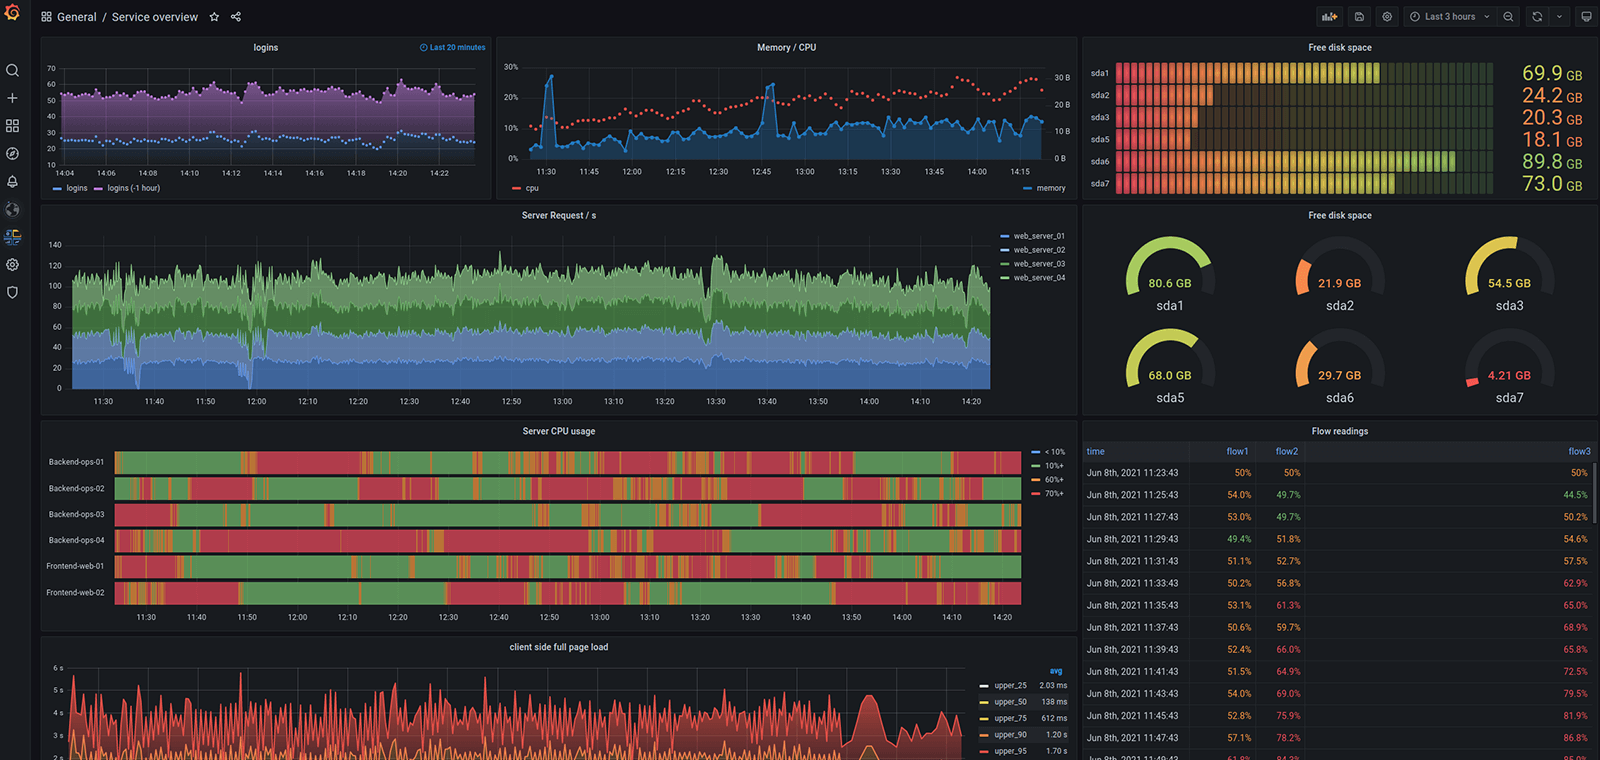
In general I would turn the stats so, that the player is enabled to create his own set of dashboards. I like for example Grafana
Image
Seeing what’s possible there and what’s implemented in Factorio makes me sad.
Of course I know that it’s not possible to put so much effort into a game to program such nice types of graphs. Because that’s needed, otherwise (see graftorio mod) it takes easily 10-20% of the performance. But I think the stats could really get some love.

Some examples:
- consistent colors (player preferences assignable?)
- support of boxed items (relationship between items)
- remember the settings of the timeframe
- scrolling/zooming in timeframe, much longer records in high resolution (player can say how much memory should be used and how much should be cut for saving)
- own stats, e.g. total amount of power from adding all power sources, how much copper is used for producing copper wire, …
- different types of lines (visibility), displaying the item in the graph
- stats on own screen (veeeery useful with the above features)
- some kind of alarms from stats
Cool suggestion: Eatable MOUSE-pointers.
Have you used the Advanced Search today?
Need help, question? FAQ - Wiki - Forum help
I still like small signatures...

mrvn
Smart Inserter
Smart Inserter
Posts: 5709
Joined: Mon Sep 05, 2016 9:10 am
Contact:

Re: Smooth graph in electrical network info and production statistics

Post by mrvn »

And what is up with the fluid graphs in factorio? I made a test with one heat exchanger being fed by infinity pipe and a pump filling a fluid wagon. Stepping through it tick by tick when a train arrives or leaves shows me the pump and heat exchanger go full flow in a tick and shut down just as fast. Yet the production window shows a ~20 ticks ramp up and down of steam production.

Is it not recording enough data and interpolating the values in the 5s graph?

UkcsAlias
Inserter
Inserter
Posts: 22
Joined: Mon Oct 04, 2021 11:07 am
Contact:

Re: Smooth graph in electrical network info and production statistics

Post by UkcsAlias »

mrvn wrote:
Mon Oct 25, 2021 11:29 pm
You aren't. You don't add up all the data points that go into each pixel. Instead it's a sliding window. As the graph advances the data point from "T-N" is subtracted and the data point for "T" is added. All the data points in between are carried over.
Even for keyframes, it has to look back to some of its old data to decide the actual keyframe information. For a 5s graph it might just use each frame independantly per pixel of width. For a 60s graph, it has to put 12 frames in each pixel. Its best to have that value calculated, rather than using just that value of that frame (if that would be done, the graph would become very bouncy and unreadable).

So thats why you decide certain keyframes. And they are based on graph durations.

Lets for simplicity only consider the following graph durations: 5s, 20s, 60s.
For each graph, you will need 300 keyframes to get a proper render. The 5s graph on that is just taking every frame.
The 20s graph, can take 4 frames and merge them to 1, which is placed in the keyframe. This means it has to perform 4 lookups worth of data to generate this information (which shouldnt be too much overhead).
The 60s graph, instead of again taking information from the 5s graph, can just directly relate to the 20s graph, and take 3 frames from that. Reducing overhead a lot.

Which calculation is used doesnt even matter a lot, as min, max and average will all give very accurate values because even though the 60s graph only takes 3 frames instead of 60, those 3 frames were all still based on the 20 frames and equaly balanced.

But it is load, and especialy on heavy saves. It does take up data into ram (note that graphs can scale verticaly, so taking an image doesnt work). And this load should be rather simple. But again, even small things can add up and influence FPS. A 0.1% additional load might not sound like a lot. But it still means that each 1000th frame you already lose 1. And that lost frame essentialy happens every 16.6 seconds.
This is why i think its a doable part. But my 0.1% might also be too optimistic. Because remember, there is a lot of data it has to look up in older frames (its not just a single number, its a lot of numbers together).

EDIT: but to note that to get keyframes, it only has to calculate this at certain frames, its not N*2 per frame, as only the 4th frame it decides the 20s frame, and each 12th frame the 60s frame. Its not even going to get close to double the costs, unless the base cost is significantly higher to counter the optimizations of the keyframes.

mrvn
Smart Inserter
Smart Inserter
Posts: 5709
Joined: Mon Sep 05, 2016 9:10 am
Contact:

Re: Smooth graph in electrical network info and production statistics

Post by mrvn »

UkcsAlias wrote:
Thu Oct 28, 2021 4:57 pm
mrvn wrote:
Mon Oct 25, 2021 11:29 pm
You aren't. You don't add up all the data points that go into each pixel. Instead it's a sliding window. As the graph advances the data point from "T-N" is subtracted and the data point for "T" is added. All the data points in between are carried over.
Even for keyframes, it has to look back to some of its old data to decide the actual keyframe information. For a 5s graph it might just use each frame independantly per pixel of width. For a 60s graph, it has to put 12 frames in each pixel. Its best to have that value calculated, rather than using just that value of that frame (if that would be done, the graph would become very bouncy and unreadable).

So thats why you decide certain keyframes. And they are based on graph durations.

Lets for simplicity only consider the following graph durations: 5s, 20s, 60s.
For each graph, you will need 300 keyframes to get a proper render. The 5s graph on that is just taking every frame.
The 20s graph, can take 4 frames and merge them to 1, which is placed in the keyframe. This means it has to perform 4 lookups worth of data to generate this information (which shouldnt be too much overhead).
The 60s graph, instead of again taking information from the 5s graph, can just directly relate to the 20s graph, and take 3 frames from that. Reducing overhead a lot.

Which calculation is used doesnt even matter a lot, as min, max and average will all give very accurate values because even though the 60s graph only takes 3 frames instead of 60, those 3 frames were all still based on the 20 frames and equaly balanced.

But it is load, and especialy on heavy saves. It does take up data into ram (note that graphs can scale verticaly, so taking an image doesnt work). And this load should be rather simple. But again, even small things can add up and influence FPS. A 0.1% additional load might not sound like a lot. But it still means that each 1000th frame you already lose 1. And that lost frame essentialy happens every 16.6 seconds.
This is why i think its a doable part. But my 0.1% might also be too optimistic. Because remember, there is a lot of data it has to look up in older frames (its not just a single number, its a lot of numbers together).

EDIT: but to note that to get keyframes, it only has to calculate this at certain frames, its not N*2 per frame, as only the 4th frame it decides the 20s frame, and each 12th frame the 60s frame. Its not even going to get close to double the costs, unless the base cost is significantly higher to counter the optimizations of the keyframes.
Which has nothing to do with this suggestion and factorio already must do something like this for it's graphs for sure. I seriously don't believe the 10h graph works with data from every tick for the last 10 hours. That would mean the graphs data store would continously grow and displaying them would be horrible slow.

The suggestion only concerns the rendering and would build the average of N key frames for each pixel. And each pixel can be computed from the previous with one addition, one subtraction and one division. And as you scroll you only need to compute one new pixel per item. So this is miniscule work. 0.00000001% region.

Oh in case it isn't clear: This extra addition, subtraction and division as well as storing the last pixels non-divided value per item in the graph is only when the graph window is open. There is 0 change for the data collection that goes on all the time.

Post Reply

Return to “Ideas and Suggestions”