TL;DR
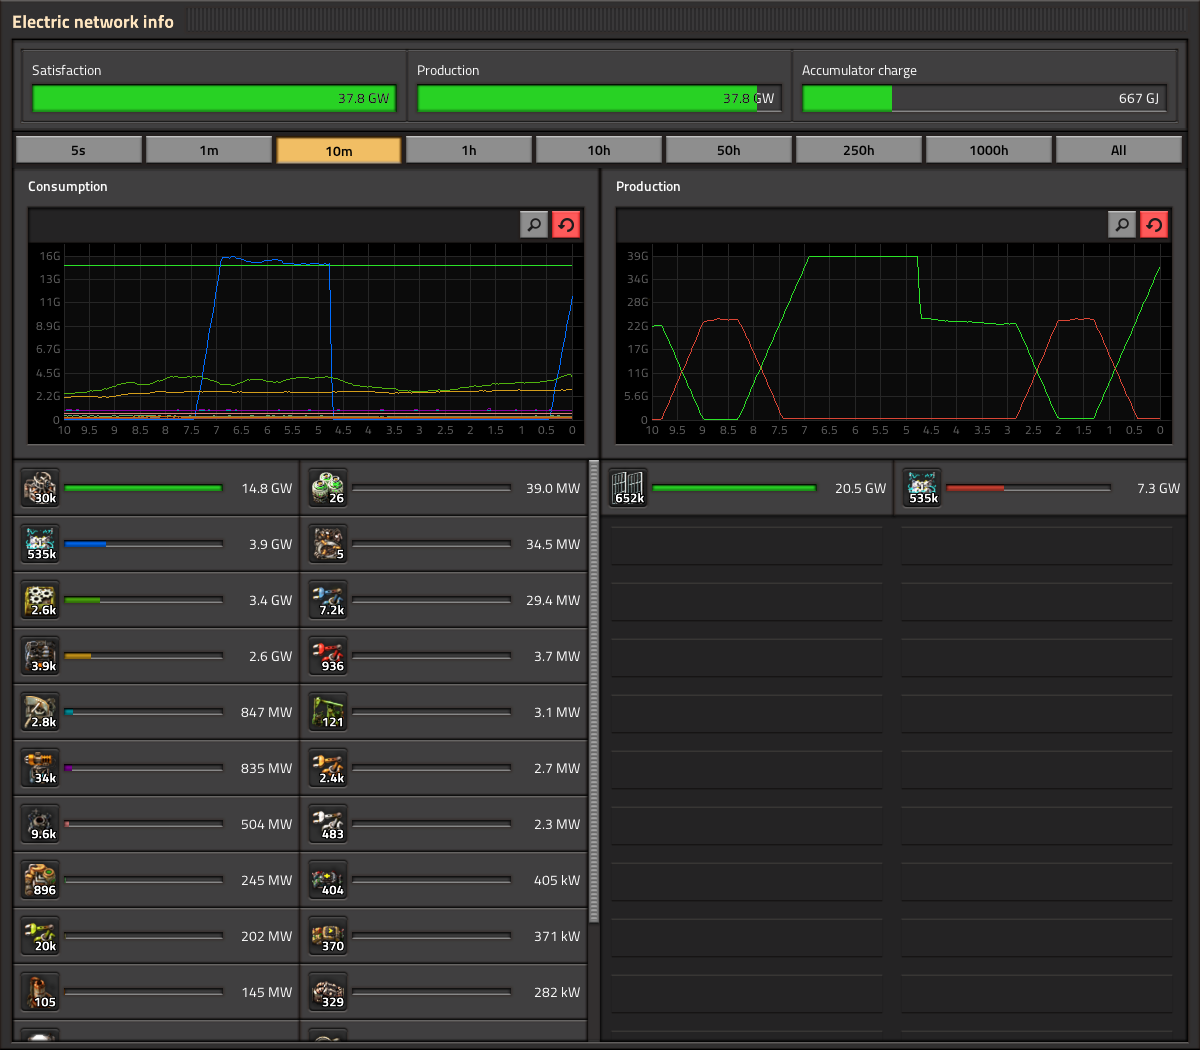
Please add an option to present Power and Pollution graphs as stacked area charts.What ?
Today all charts in the game are line charts.
I propose implementing a new visualization type - stacked area charts. This option would be exposed through a toggle control in the chart UI in line with the other buttons directly above the chart (or else in the player settings menu) to switch between line chart and stacked area chart. This is requested specifically for Power and Pollution charts, but it could be offered on all charts for consistency.


