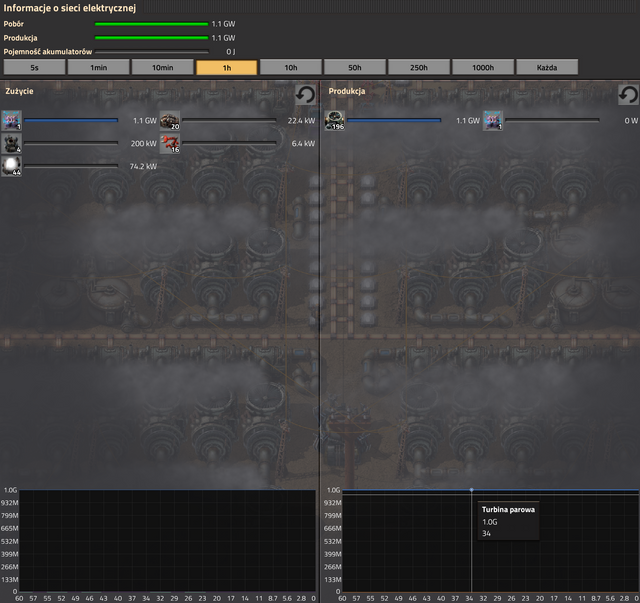
I've noticed a rounding problem. I've created a new map to test my new nuclear power plant setup. Is all OK, producing power but... I see strange rounding problem. On gauge I see 1.1 GW. On chart (if I hover mouse on line) I see 1.0 GW. Gigawatts are not small numbers that one lamp can ruin all calculations.
Setup is created with power interface what is consuming all produced energy, no any other power producing entity is on a map. As screen below, I run this map for 3 hours and nothing change. 100 MW "gone" in chart.
I had similar issue yesterday. Chart (on a left / usage side) was showing 1kW more than what the bars were showing, and 1kW more than it absolutely max possible (these were miners I think).
On the topic of rounding, 1.1GW is rather wide spread of possible values (10%, or if you don't know how they are rounded 20%). IMHO 1.10GW would be more useful. Once it crosses 10GW, go back to 0.1GW resolution, so 10.1GW.