Page 1 of 1
What are the x axis units in the 250h and 1000h graphs?
Posted: Sat Feb 15, 2020 5:21 pm
by JasonC
What are the X axis units on the 250h and 1000h graphs?
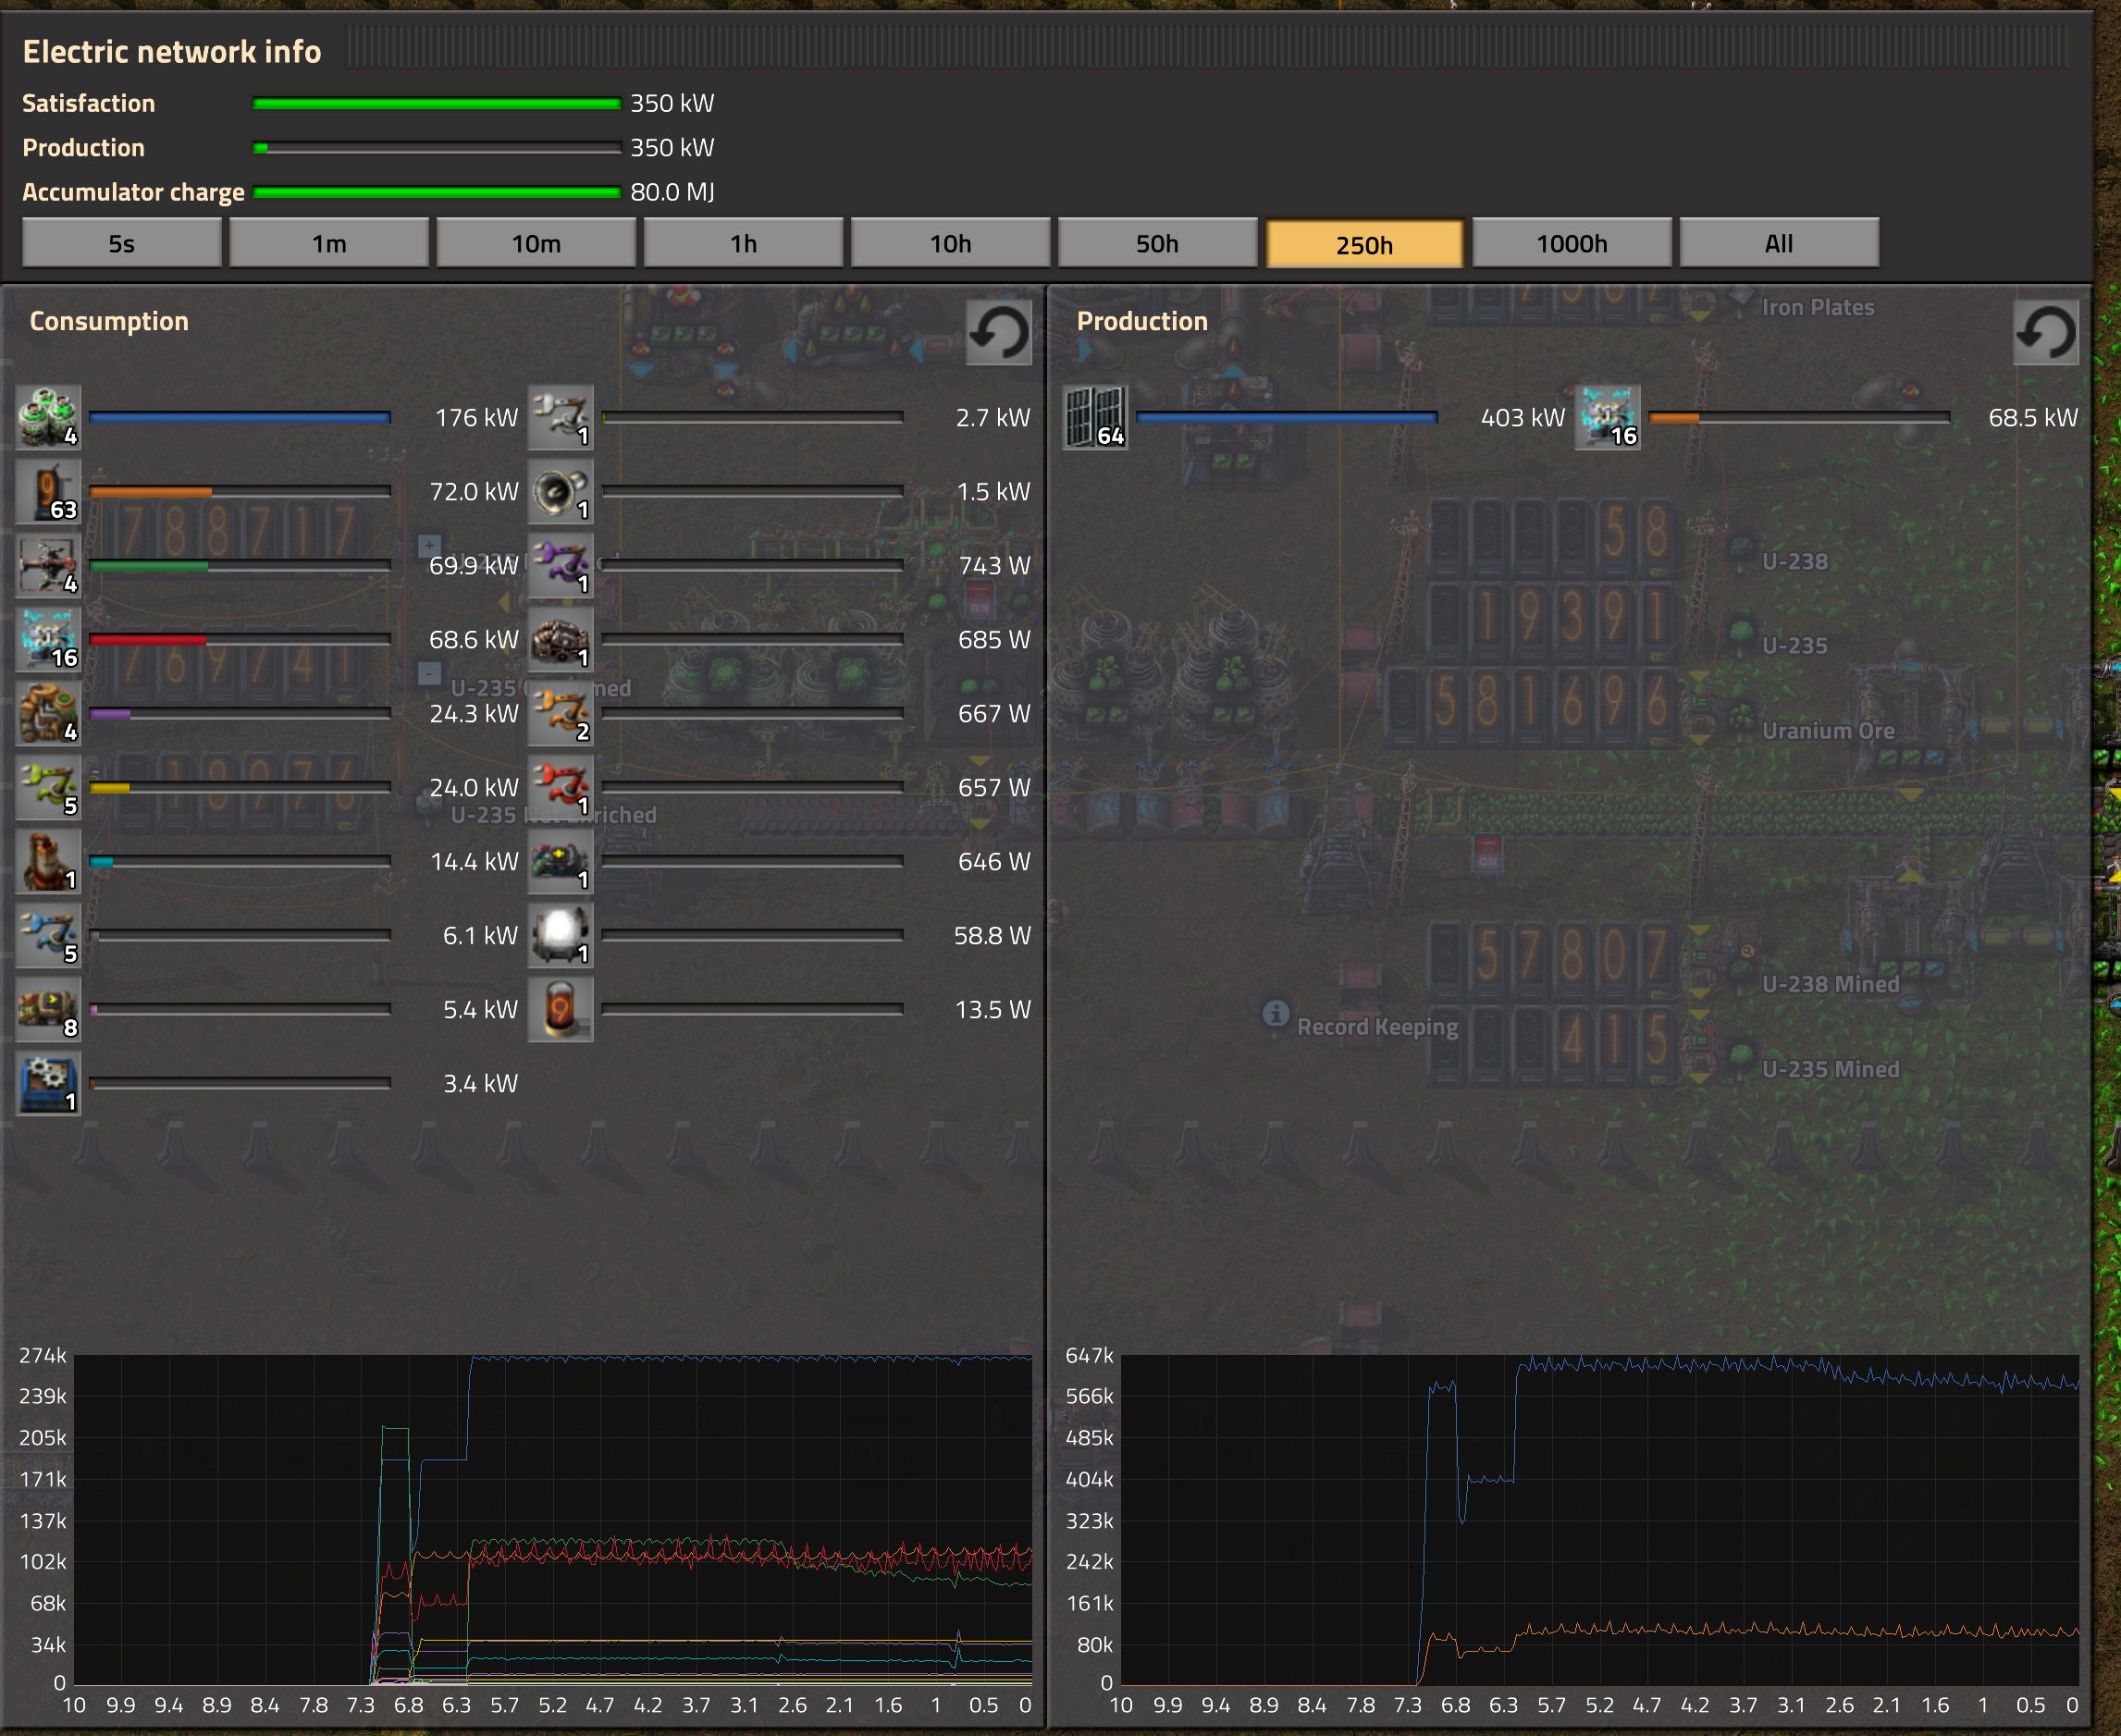
- units.png (4.57 MiB) Viewed 2149 times
I thought they were days at first but the 250h graph only goes to 10 (= 240h)?
Re: What are the x axis units in the 250h and 1000h graphs?
Posted: Sat Feb 15, 2020 7:54 pm
by Jap2.0
Could 10 be a truncated form of 250/24 (10.4)?
Re: What are the x axis units in the 250h and 1000h graphs?
Posted: Sat Feb 15, 2020 9:20 pm
by Xeorm
Jap2.0 wrote: Sat Feb 15, 2020 7:54 pm
Could 10 be a truncated form of 250/24 (10.4)?
This would be my guess. 1000h also ends at 42. 1000/24 =41.666.
Re: What are the x axis units in the 250h and 1000h graphs?
Posted: Sat Feb 15, 2020 10:01 pm
by darkfrei
Another question - why here is 9.1 but not 9?
Re: What are the x axis units in the 250h and 1000h graphs?
Posted: Sun Feb 16, 2020 1:56 am
by JasonC
Jap2.0 wrote: Sat Feb 15, 2020 7:54 pm
Could 10 be a truncated form of 250/24 (10.4)?
Oh I think you are right.
It could be that it's just displaying 2 digits no matter what, so it chops off the .4 for the 10.4.
It looks weird but makes logical sense I guess.
darkfrei wrote: Sat Feb 15, 2020 10:01 pm
Another question - why here is
9.1 but not
9?
Lol... I never noticed that. How strange. It's on both the 1m and 1h graph.
I can't really figure that one out unless maybe the graph is actually somewhere between 60 and 61 seconds/minutes so the lines are just over 3 units apart? Or something?
Re: What are the x axis units in the 250h and 1000h graphs?
Posted: Sun Feb 16, 2020 2:17 am
by Squelch
darkfrei wrote: Sat Feb 15, 2020 10:01 pm
Another question - why here is
9.1 but not
9?
I thought I read that the X axis numbers were corrected in the recent past. Checking the changelog shows I might have misunderstood how.
0.17.43
Code: Select all
- Fixed statistics graphs X axis labels showing wrong values for 250h and 1000h time frames. (https://forums.factorio.com/71091)
The 5s statistics X axis is really bad and I'd dare say unreadable.
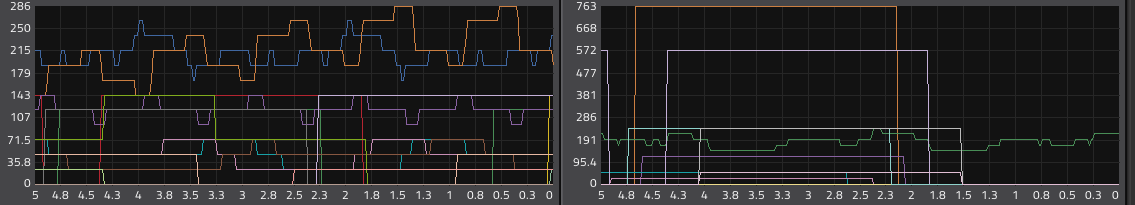
- 5s X-Axis.PNG (22.84 KiB) Viewed 2105 times
It would seem that the current screen resolution determines the numbers displayed for the X axis.
[Edit for correction]
Doh! it's rounding, not resolution. Too many hours working through a game in my defense

This might fall under minor issues methinks. 20 divisions should have sensible values whatever the current statistical history is displaying.
[Edit 2]
Reported
Statistics X axis numbers show odd rounding issues