Page 1 of 1
Merge Science Production Graph
Posted: Fri Aug 22, 2025 2:41 am
by Epb7304
TL;DR
Science production graph should be with the other production graphs
What?
Currently the production statistics graph contains 5 tabs, Items, Fluids, Buildings, Pollution, Kills
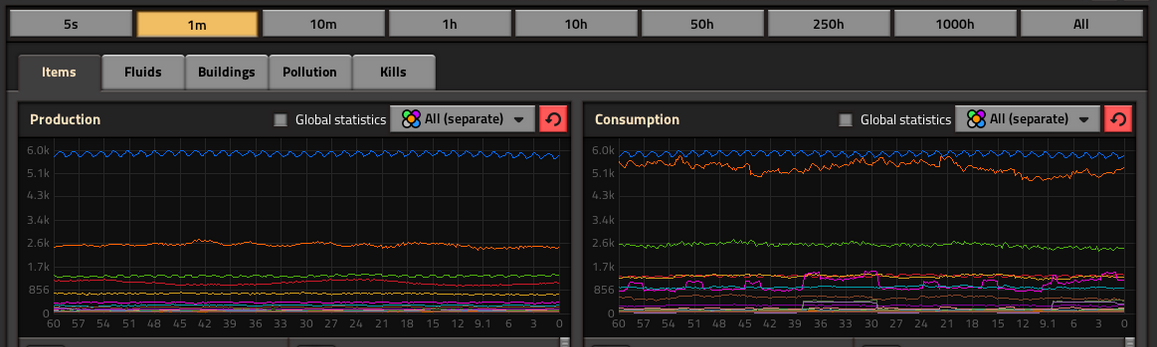
- 08-21-2025, 22-36-12.png (219.5 KiB) Viewed 1288 times
And the science production graph, seen by hovering over a currently researching tech can
only be seen by hovering over a currently researching tech. I propose that this production graph be added to the production statistics. the same information should be available, the amount of ESPM (effective science per minute) being created, the estimated time to research completion, and a graph of current ESPM production
Why?
This should be done because it follows logically that a production graph should be in the production statistics tab, and its odd that it does not.
Re: Merge Science Production Graph
Posted: Fri Aug 22, 2025 6:56 pm
by crimsonarmy
It feels a bit odd to do this because it isn't item production (kind of like adding pollution production to the production graph).
Re: Merge Science Production Graph
Posted: Sat Aug 23, 2025 12:42 pm
by Amarula
I am wondering what this does to the scale on the production graph... yeah producing and consuming 20K science packs per minute and what was that? 2.5M eSPM? And suddenly you can't see anything else on the production graph...
Perhaps giving eSPM its own tab like pollution or kills?
Re: Merge Science Production Graph
Posted: Mon Dec 29, 2025 1:34 pm
by Epb7304
Amarula wrote: Sat Aug 23, 2025 12:42 pm
I am wondering what this does to the scale on the production graph... yeah producing and consuming 20K science packs per minute and what was that? 2.5M eSPM? And suddenly you can't see anything else on the production graph...
Perhaps giving eSPM its own tab like pollution or kills?
perhaps I was not clear before but that is the suggestion, merge it into the same list of tabs, give science production its own graph tab like pollution, kills, production, etc.
Re: Merge Science Production Graph
Posted: Mon Dec 29, 2025 1:54 pm
by Kyralessa
Epb7304 wrote: Mon Dec 29, 2025 1:34 pm
perhaps I was not clear before but that is the suggestion, merge it into the same list of tabs, give science production its own graph tab like pollution, kills, production, etc.
That sounds like a good idea. I'm surprised it's not already like that.
Re: Merge Science Production Graph
Posted: Mon Dec 29, 2025 3:30 pm
by Tertius
You can press ctrl-f and search for "science" (localized to your language) in the item tab, then you get a filtered graph including eSPM:
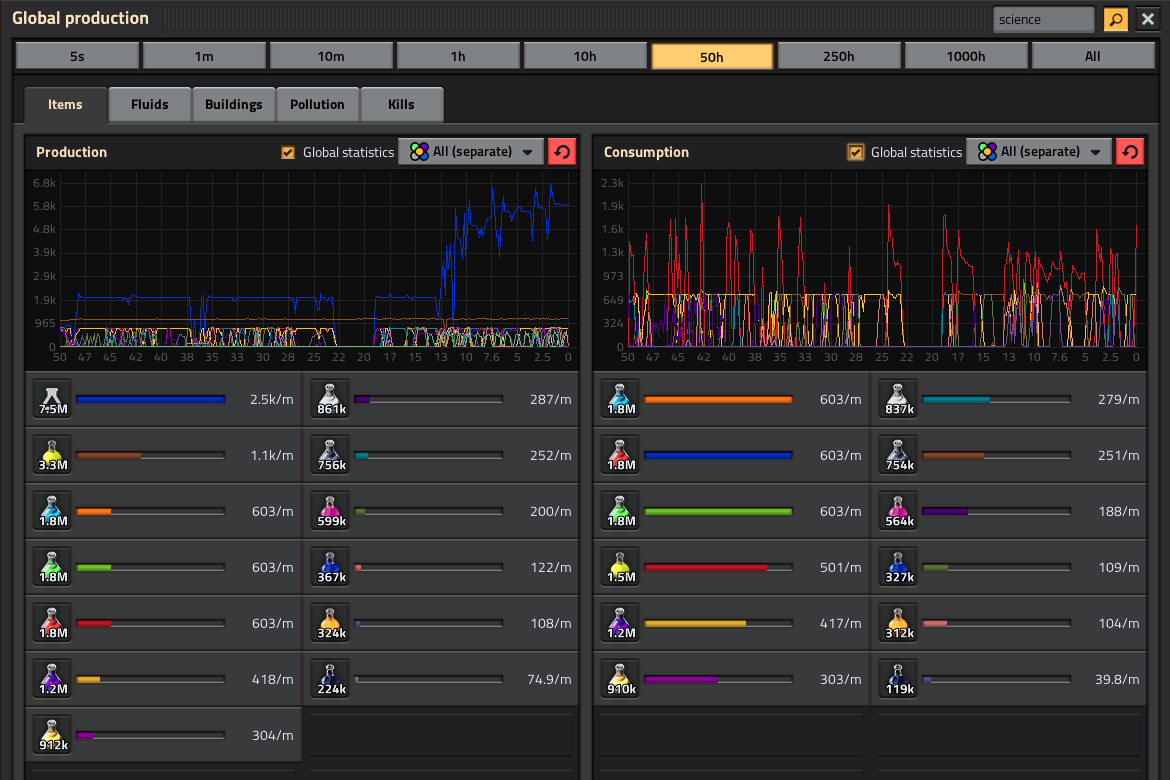
- 12-29-2025, 16-31-32.png (139.69 KiB) Viewed 817 times
I guess that's so easy it doesn't warrant its own tab. Caveat: the filter is gone if you close the window and you have to type it again.
Re: Merge Science Production Graph
Posted: Mon Jan 05, 2026 2:44 pm
by Koub
Produced and consumed science packs as items is one thing, actual science researched within a lab is another thing.
For example, one could imagine a situation where a science pack would be an ingredient for another item. Science packs would be consumed, but 0 science produced.
A way to measure the quantity of research generated could make sense, and my understanding is that it's exactly what OP is asking for. Obviously, there could be only one graph because production and consumption would be basically the same thing.