Page 2 of 4
Re: Consumption/Production / Electric Network Info / Power M
Posted: Tue Jun 17, 2014 8:41 am
by Rahjital
ssilk wrote:Supply and demand.
This would be a super quick fix. +1
I agree completely. Just to be clear, the "Consumption" meter should be renamed to "Supply" and the "Production" should be relabeled to "Demand". That way, when Demand is higher than Supply, you know you have a problem.
Re: Consumption/Production / Electric Network Info / Power M
Posted: Sat Jun 21, 2014 11:03 am
by MF-
Rahjital wrote:ssilk wrote:Supply and demand.
This would be a super quick fix. +1
I agree completely. Just to be clear, the "Consumption" meter should be renamed to "Supply" and the "Production" should be relabeled to "Demand". That way, when Demand is higher than Supply, you know you have a problem.
Hehe, it took me quite a while to understand,
but that'll indeed work nicely.
+1
Re: Consumption/Production / Electric Network Info / Power M
Posted: Sat Jun 21, 2014 11:39 am
by Gammro
Rahjital wrote:ssilk wrote:Supply and demand.
This would be a super quick fix. +1
I agree completely. Just to be clear, the "Consumption" meter should be renamed to "Supply" and the "Production" should be relabeled to "Demand". That way, when Demand is higher than Supply, you know you have a problem.
Sorry, that's a bad idea. You want to rename the thing that indicates supply to demand and the thing that indicates demand, you want to rename supply?

That's the opposite of being intuitive.
Hehe, it took me quite a while to understand,
Actually says enough about it not being intuitive.
Re: Consumption/Production / Electric Network Info / Power M
Posted: Sat Jun 21, 2014 11:56 am
by CreeperDaReeper
Gammro wrote:Rahjital wrote:ssilk wrote:Supply and demand.
This would be a super quick fix. +1
I agree completely. Just to be clear, the "Consumption" meter should be renamed to "Supply" and the "Production" should be relabeled to "Demand". That way, when Demand is higher than Supply, you know you have a problem.
Sorry, that's a bad idea. You want to rename the thing that indicates supply to demand and the thing that indicates demand, you want to rename supply?
That's the opposite of being intuitive.
Hehe, it took me quite a while to understand,
Actually says enough about it not being intuitive.
Actually he's right.
-Consumption should be relabeled Supply because that's how much energy is currently being supplied to the network by the generators.
--When the Consumption/Supply bar is full, that means the network is getting fully supplied with energy.
-Production should be relabeled Demand because that's how much energy the network is demanding compared to the max output of the generators.
--When the Production/Demand bar is full, that means the network is demanding, as much energy as / or more energy than, the generators can produce.
Re: Consumption/Production / Electric Network Info / Power M
Posted: Sat Jun 21, 2014 11:58 am
by Rahjital
Gammro wrote:Sorry, that's a bad idea. You want to rename the thing that indicates supply to demand and the thing that indicates demand, you want to rename supply?
That's the opposite of being intuitive.
That's because it's reversed currently. Think abou it for a minute. As it is now, your Production is always lower than your Consumption - unless you don't have enough electricity,
in which case Production is higher. That's what is unintuitive and why this topic exists in the first place.
Not understanding why a change is needed is not the same as the end result of the change being unintuitive.

Edit: Whoa, ninja'd by CreeperDaReeper. Thank you for explaining it, you did it a lot better than I did.
Re: Consumption/Production / Electric Network Info / Power M
Posted: Sat Jun 21, 2014 12:09 pm
by Gammro
CreeperDaReeper wrote:
Actually he's not right.
-Consumption should be relabeled Supply because that's how much energy is currently being supplied to the network by the generators.
--When the Consumption/Supply bar is full, that means the network is getting fully supplied with energy.
-Production should be relabeled Demand because that's how much energy the network is demanding compared to the max output of the generators.
--When the Production/Demand bar is full, that means the network is demanding, as much energy as / or more energy than, the generators can produce.
Consumption is the rating of what the network is drawing compared to what it wants to draw. Therefor, dependent on the CONSUMPTION/demand.
Production is the percentage rating of what can be produced vs what is being produced. Therefor, dependent on the PRODUCTION/Supply.
You guys are looking at the graph in a way that it is not meant to be looked at that way.
Anyway, here's what I did to make it clear in one blink of an eye:
Re: Consumption/Production / Electric Network Info / Power M
Posted: Sat Jun 21, 2014 12:41 pm
by CreeperDaReeper
Gammro wrote:
Still looks like you're producing 1/3 of what you're consuming.
Or it looks like you're consuming nearly 3 times what you're producing.
(Editing what I said within the quote on your own post? Tsk tsk. Poor show old chap. Poor show.)

Re: Consumption/Production / Electric Network Info / Power M
Posted: Sat Jun 21, 2014 12:55 pm
by Gammro
CreeperDaReeper wrote:Gammro wrote:
Still looks like your producing 1/3 of what you're consuming.
Or it looks like your consuming nearly 3 times what you're producing.
Really, I can't explain it any other way. Read the labels, numbers etc.
I don't know what your background is, I like to think I know something about (electric)energy because my background is in EE. So I don't know why you can't understand the way the meters work.
psst: you're and your
Re: Consumption/Production / Electric Network Info / Power M
Posted: Sat Jun 21, 2014 1:16 pm
by CreeperDaReeper
Gammro wrote:Really, I can't explain it any other way. Read the labels, numbers etc.
I don't know what your background is, I like to think I know something about (electric)energy because my background is in EE. So I don't know why you can't understand the way the meters work.
I do understand how they work.
The top bar, Consumption, shows how much energy the network is getting compared to how much it needs. When it is full, the network is getting all the energy it needs.
The bottom bar, Production, shows the current output of the generators compared to their maximum output. When this bar is full, Consumption is either equal to, or greater than maximum output.
The problem here is that, (and this is just a guess), most people would assume that at a glance, that the top bar, (Consumption), shows how much energy is being used by the network compared to how much energy the generators can supply.
Compounding that, (again another guess), is that new players don't know that generators, (at least Steam Engines for now), only make as much energy as the network is currently demanding. So they might think that because the bottom bar usually isn't full, that many of their generators, (Steam Engines), aren't working/generating/producing.
Re: Consumption/Production / Electric Network Info / Power M
Posted: Sat Jun 21, 2014 1:27 pm
by Rahjital
Remember that this doesn't matter to experienced players like us in any way since we already know how things work. The point of the suggestion is to make it friendlier for the newbies. This very thread is the evidence showing how many people were confused by it in their beginning. It doesn't matter how things go in electrical engineering, Factorio is a game, not a training simulator for Amazon employees. Making the interface easier for new players is important.
Re: Consumption/Production / Electric Network Info / Power M
Posted: Sat Jun 21, 2014 2:00 pm
by Gammro
Redefining what demand and supply mean, would not help that cause though. It would confue players who do know what it means. I honestly believe my edit is a step in the right direction. I wanted to change production too, but couldn't find a word that described what I had in mind. Saturation, maybe?
Re: Consumption/Production / Electric Network Info / Power M
Posted: Sat Jun 21, 2014 8:30 pm
by robhol
Gammro wrote:
You guys are looking at the graph in a way that it is not meant to be looked at that way.
Anyway, here's what I did to make it clear in one blink of an eye:
Of course we are. But with labels that weren't
wrong, we wouldn't be having this discussion.
"How much power are my solar panels currently producing?" (Common sense) vs "How much power are my solar panels currently consuming?" (Factorio electric stats)
"How much power is this Lab consuming?" (Common sense) vs "How much power is this Lab producing?" (Factorio electric stats)
I think either switching them (so "
production" is the thing that increases once you add something that
produces power) or just relabelling them to supply and demand are completely valid.
What I definitely don't understand is how this isn't bleeding obvious.

Re: Consumption/Production / Electric Network Info / Power M
Posted: Mon Jun 23, 2014 1:23 pm
by Turtle
I totally agree that it's misleading at first. I couldn't understand it at first glance either. However, these statements are why you find it really confusing.
robhol wrote:"How much power are my solar panels currently producing?" (Common sense) vs "How much power are my solar panels currently consuming?" (Factorio electric stats)
"How much power is this Lab consuming?" (Common sense) vs "How much power is this Lab producing?" (Factorio electric stats)
I think either switching them (so "
production" is the thing that increases once you add something that
produces power) or just relabelling them to supply and demand are completely valid.
What I definitely don't understand is how this isn't bleeding obvious.
It's not how much they are currently consuming. It's how much power they are producing compared to their capacity. They do not need to produce more than is needed on the network. That's why you see the bar fluctuate so much. If more power was produced than needed, where would it go? All your machines would fry if they got all the power that solar panels/steam engines would produce. Imagine if the power was in liquid form that HAD to go somewhere. You have 20 gallons and a machine needs 5 gallons, but the 20 gallons have to go somewhere, so they would flood your machine.
So I was thinking what exactly was confusing about the current display. The top bar, Consumption - which is technically the demand of power, is always full (assuming you have enough power), while the bottom bar, Production - the supply of power, is fluctuating depending on demand. The problem that I see is that most people expect a bar of a certain size to always be the same value. The Consumption bar currently fluctuates, but the size of the bar remains the same.
Let's make an example:
You have 10 steam engines for power, which is about 5 MW. If you sit and look at your Consumption bar you'll see it go from, for example, 2.8 MW to 3.2 MW. Now imagine if that bar was ALWAYS 5 MW. Now what would that bar do? It would fluctuate just like the Production bar - so the Consumption bar and the Production bar would ALWAYS be the same, unless your demand exceeded the supply.
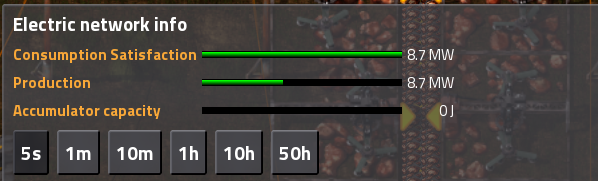
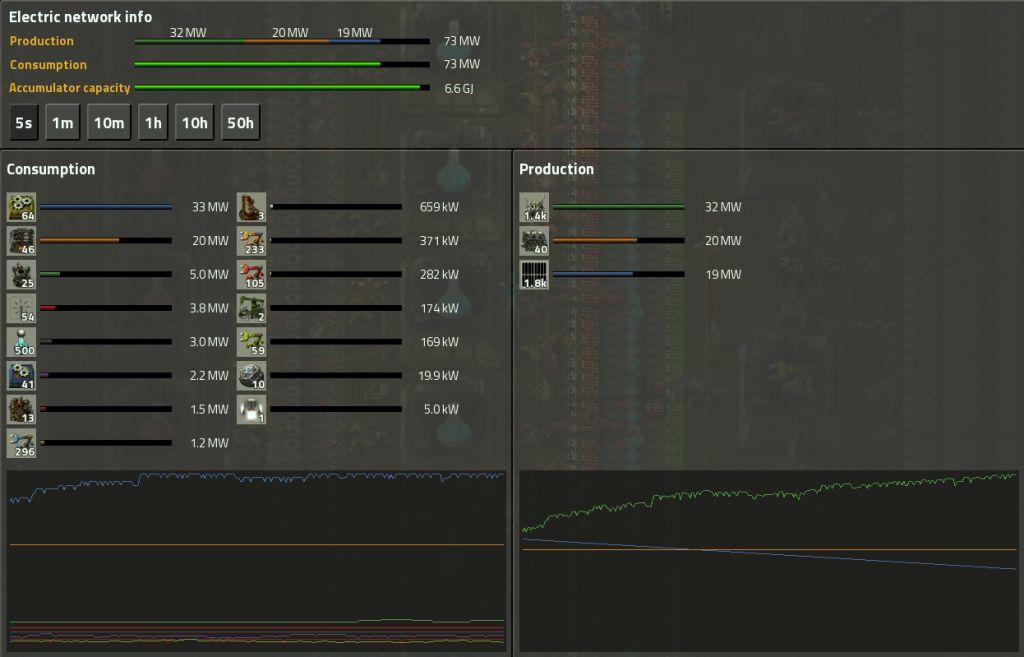
So I was thinking, "How could this information be displayed in a more easy-to-view manner?" So this is what I came up with:
- Power_night.jpg (67.68 KiB) Viewed 12499 times
While I was doing this, I realized both bars would always be the same size all the time. So we don't even need two bars. Having the top bar that says Production is enough. Let me break down the information, if it's not clear. The entire bar is Power Capacity - how much you are able to produce. The first green bar is accumulator power production (I took the screenshot during the night) producing 32 MW. The orange bar is steam engine power production producing 20 MW. The blue bar is solar panel power production producing 19 MW. The demand of power bar? Why have it there? In my picture, they would ALWAYS be the same, unless your demand exceeded your capacity. The top bar already shows how much demand there is AND it breaks it down what is supplying that power. If power demand ever exceeds capacity, make the entire bar full and red.
Is that easier to read? What are some possible flaws doing it this way?
Re: Consumption/Production / Electric Network Info / Power M
Posted: Mon Jun 23, 2014 2:06 pm
by robhol
I think your solution works too, Turtle. Still, I think it's simple enough to just rename them Supply and Demand, which is completely clear.
In any case, I think it'd be a good idea to add a very simple visual cue - green if the power supply outweighs the demand, yellow if they're close, red if you're not keeping up with the demand and need to take action.
Re: Consumption/Production / Electric Network Info / Power M
Posted: Mon Jun 23, 2014 4:31 pm
by ssilk
Hm. I'm not sure if that is enough.
In every case I want to have just a very simple "Do I produce enough to satisfy everything"-Meter and a "How much reserves do I currently have"-Meter.
That are the both bars yet - the information is there.
I think the problem with them is, that they show the "absolute value", instead of "how much more do I need or am I producing much too much?".
The absolute value is (normally) the used power. That can be shown just as a number! I was once in a nuclear power plant and they showed the currently produced power also as a big number display on the wall and not as a voltmeter-like bar or arrow, that makes no sense; that's what numbers are for.

Re: Consumption/Production / Electric Network Info / Power M
Posted: Tue Jun 24, 2014 2:06 am
by Turtle
ssilk wrote:Hm. I'm not sure if that is enough.
In every case I want to have just a very simple "Do I produce enough to satisfy everything"-Meter and a "How much reserves do I currently have"-Meter.
If you look at the image I posted, the Production bar shows all that information. The entire bar is the total power you are capable of producing. If the entire bar is not full, you are producing enough. You can also see if you are close to needing more power.
Re: Consumption/Production / Electric Network Info / Power M
Posted: Tue Jun 24, 2014 6:50 pm
by ssilk
Turtle wrote:
If you look at the image I posted, the Production bar shows all that information.
Hmmm. My true opinion is: if I would be a beginner it shows nothing relevant for me.
The entire bar is the total power you are capable of producing. If the entire bar is not full, you are producing enough. You can also see if you are close to needing more power.
The problem is: you need to explain it more then a sentence. But it should explain itself. My opinion.
Re: Consumption/Production / Electric Network Info / Power M
Posted: Tue Jun 24, 2014 8:21 pm
by Khyron
I think there is a case for changing the current system. The reason is very simple. There are two use cases: You have enough energy production or you don't. Regardless of which state you're in, one of the bars is redundant. If I have enough energy production, the consumption bar is redundant. If I don't, the production bar is redundant.
The player is interested in one piece of information: the difference between supply and demand.
I would suggest showing one bar with zero in the center. If your factory has spare energy generating capacity, draw a green line to the right. If it could use more power than it can produce, draw a red line to the left. Write the magnitude in text.
Re: Consumption/Production / Electric Network Info / Power M
Posted: Tue Jun 24, 2014 8:40 pm
by Gammro
Khyron wrote:I think there is a case for changing the current system. The reason is very simple. There are two use cases: You have enough energy production or you don't. Regardless of which state you're in, one of the bars is redundant. If I have enough energy production, the consumption bar is redundant. If I don't, the production bar is redundant.
The player is interested in one piece of information: the difference between supply and demand.
I would suggest showing one bar with zero in the center. If your factory has spare energy generating capacity, draw a green line to the right. If it could use more power than it can produce, draw a red line to the left. Write the magnitude in text.
Seems like a nice suggestion, but would the amplitude be the deficit/overcapacity or the absolute production?
QuickEdit: Probably deficit, but I'd like the total production to be there as well for e-peen purposes.
Re: Consumption/Production / Electric Network Info / Power M
Posted: Tue Jun 24, 2014 10:15 pm
by robhol
I also suggested the bar-from-center. There's a significant flaw that I couldn't figure out, though. Problem is that while the surplus/deficit is a critical piece of information, there's no "obvious" metric to compare it with - so, let's say you have a gigawatt or so in excess of what you're using - how do you represent that? How large should the green bar be, and what are you measuring it up against?
It'd look a lot prettier, but you'd basically have to "bullshit" a value or a reason to use a value that doesn't really fit.
The two bars can work - again, they just need the proper labels. And adding a clear text label that displays the current surplus/deficit would probably be a good idea.