Hey i have made some other graphs to make some predictions that i then tried to verify in game and attaching everything !
https://www.desmos.com/calculator/x9pc6ycsqv
This is done to illustrate some points that were discussed, including the effect of the block length on the apparition of traffic jam and their disruptive nature on the throughput, and another way of calculating train throughput and max throughput. Hopefully it is more accessible than the wikipedia pages about traffic flows

The basic idea was to create a loop instead of considering the infinite straight line. This introduce a finite distance, which means a hard limit on the number of trains that can fit on such loop, or their size. From this it is possible to math how much space is occupied by trains and how much space is left unocupied, free for train to reserve as their braking distance. The limitation of the distance available for each train as braking distance is creating a cap on the speed a train is allowed to go if we consider equal spacing between trains because going faster would mean reserving the block occupied by the train in front of it.
Hopefully it illustrate what is the maximum throughput described in the other graph.
How to read
- how to use graph.png (81.74 KiB) Viewed 7842 times
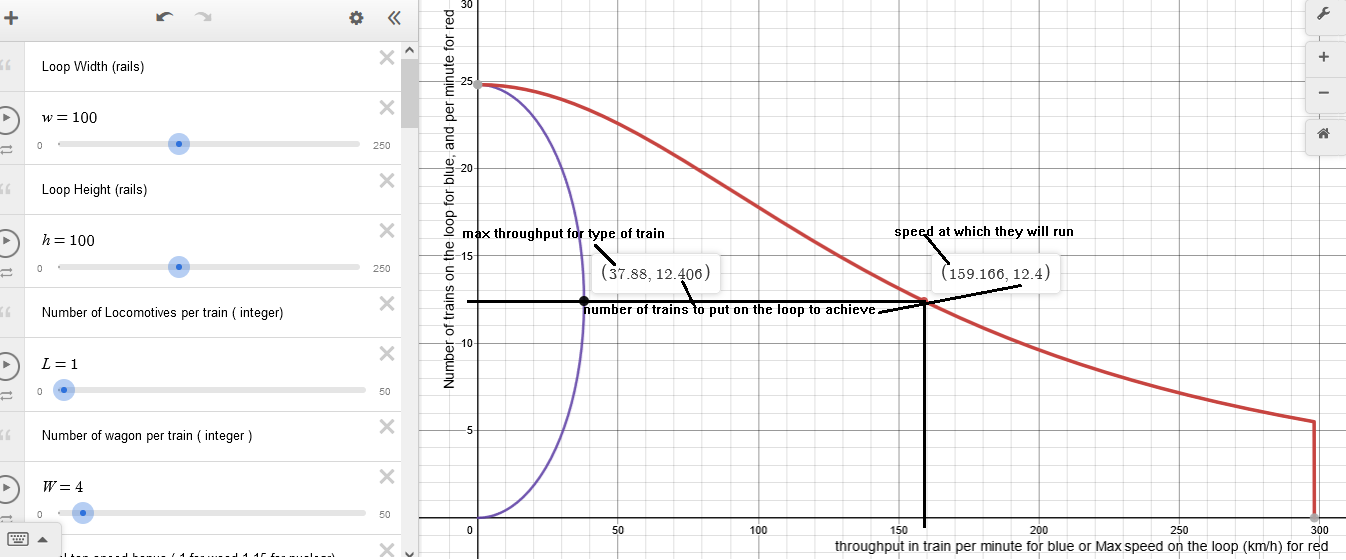
The Blue curve represent how the number of train impact the throughput. When there is 0 train, the throuput is 0 ( obvious). When there is too many trains, the throughput is 0. ( tail-to-nose distance = 0 = deadlock). Everywhere in the middle there is some throughput. The black dot on the blue curve represent the "max throughput" on the horizontal axis, the blue curve goes no more to the right than 37.88 train per minutes. ( this is the same value as farcast model using the same formulas, this is where one can measure discrepancies !

) This throughput is achieved with 12.406 trains considering the size of the loop on which they are placed, and the size of the train and abstracting signals for now. This is not possible obviously so it is going to be 12 trains.
But if one wanted to achieve the mathematical perfection, those 12.406 trains would have to run at 159.166 km/h.
The red curve shows what happens in game to the speed of those trains if you use more or less than 12. More than 12, it's looking at the upper part of that curve, where it goes near the origin, meaning 0, meaning if you add more and more trains after 12 , their speed will be lower and lower than 159.66 km/h, because they will not have enough room on the loop for a braking distance implied by a larger speed, up to the point where it's 0 and not drawn , because that would mean more trains and loco that what can fit on the loop and one is not allowed to do superposition yet.
If one uses less than 12 trains, well then trains are not capped at 159.166km/h, one has to go "down" the red curve, and it is going "right", instead they go faster because there is more free room to reserve for braking distance, however they are still capped by the game max speed or by their acceleration if there are too many wagons and poor fuel hence the vertical end on the right part ( if present train speed is capped by game, if not train speed is capped by train acceleration/wagon ratio).
In the desmos graph , one can change the number of locomotives or wagons, or the fuel acceleration/top speed. But also the loop "height" and "width" , the total perimeter of the loop is calculated using values from this thread :
viewtopic.php?t=109189 , supposedly players don't only make loops but it's no time to complicate things.
Accuracy
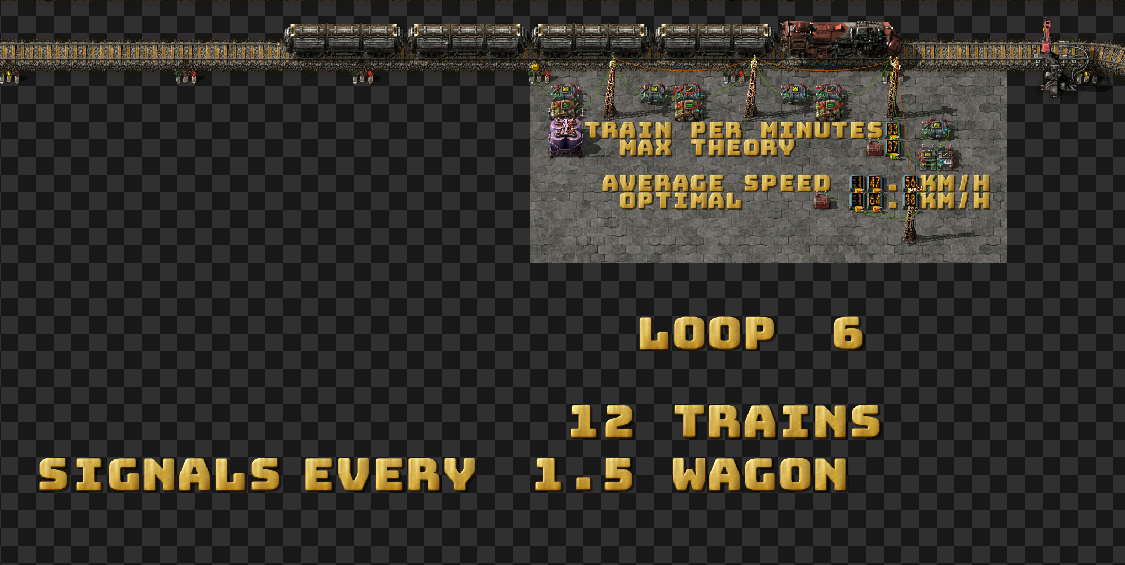
With signals everywhere :
- accuracy 2.png (662.88 KiB) Viewed 7842 times
So clearly something is wrong, there is no trains going 325.50 km/h , but using 12 trains on such loops with signals as close as allowed by the game makes the train counter i borrowed from disentius (thanks !) struggle a little bit . With 12 trains, and not 12.406 , they should be going at 164.38km/h that is a hardcoded number by me, as read from the graph on the red curve at 12 trains on the vertical axis, that is the speed indicated on the horizontal axis. This should yield a throughput of 37 trains per minutes and not 74. as if trains were going 325.50 km/h.
But i made a manual 1 minute counter so i count trains like you know 1 2 3 4 ... since there are only 12 trains, in a minute it must have done 3 turn or so, because i counted 37 trains, that's the other hardcoded number, that' why it's called manual count, i only did this when the counter didn't work because i had already produced much intellectual effort compared to my everyday that i felt a little exhausted. Though it is possible to use the editor and go "custom 3600 tick " at speed x4 to count faster and not risk missing the lamps due to the intense focus on trains passing.
Also looking at the speed of the trains in game shows they are "around" the predicted values. I blame the inaccuracies and variation on the impossibility to signal the angle of the loop as close as the straight rails, it is also why i decided to pick such large loops, compared to the tinier one i made initially that were showing higher inaccuracies / speed variation.
1 of them with only 8 trains, which was expected to yield a throughput of 35 and also made the counter struggle but was counted manually at 35.
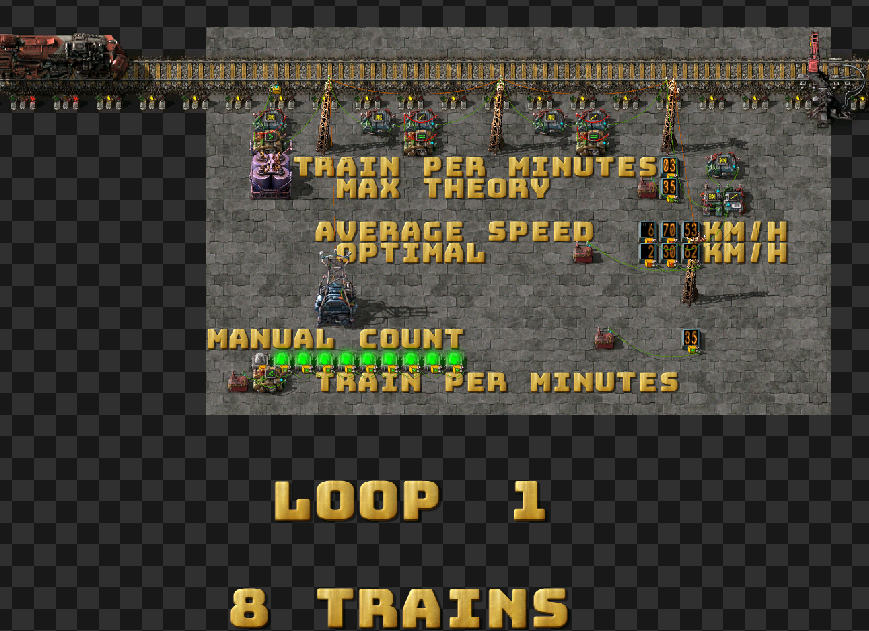
- accuracy 1.png (488.75 KiB) Viewed 7842 times
Exploration and breaking the model
There are 6 of those loops in the linked map :
Then i started to space out the signals but still using 12 trains on the same size loops. ( it made the train counter more accurate ).
This way the difference in throughput or speed average of the train or just general behavior could be explained only by the size of block length. And i wanted to know how far away need the signal to be for the throughput to be effectively lowered, and when a traffic jam would start to appear.
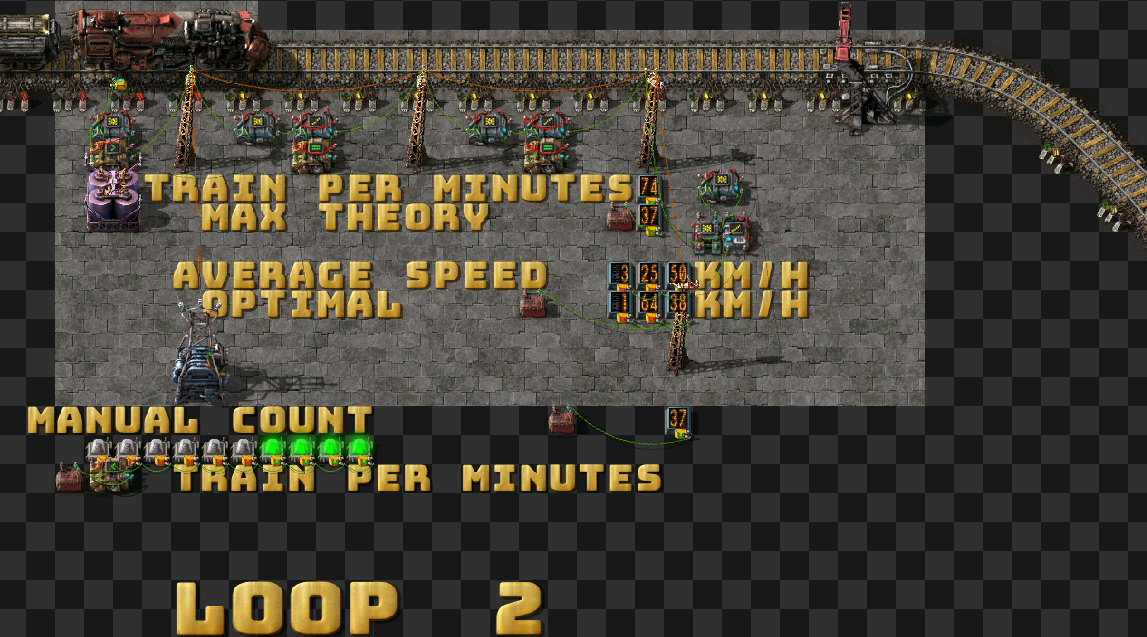
This is the further i placed signals without having traffic jam forming :
- loop6.png (315.25 KiB) Viewed 7842 times
It says 1.5 wagons but really it's 9 tiles and i haven't tried 10.
There is only 33 trains per minutes instead of 37, and they are going 147 km/h instead of the 164 km/h from the graph so throughput is impacted but the type of flow for the traffic isn't yet, the trains still hits block at the same time and keep equal spacing.
This is the smaller increment immediatly above that i tried and failed, meaning there are traffic jams visible on the map propagating backward compared to the traffic flow. signals are too far away from each other
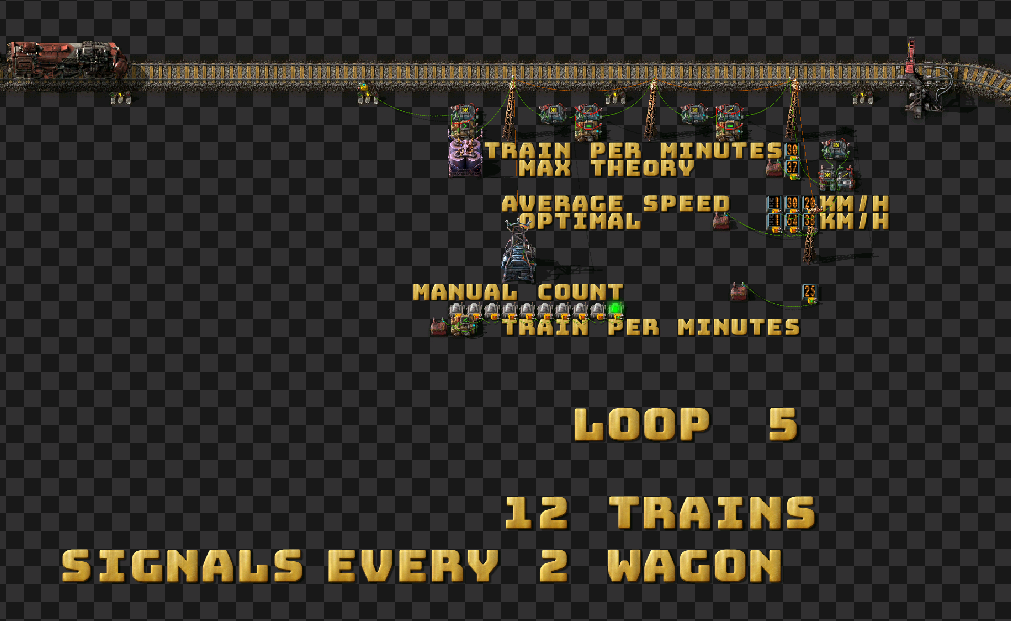
- loop5.png (192.95 KiB) Viewed 7842 times
i had to use the manual counter because there is high variation on the nixies tube when the traffic jam is sitting on the counter, the accurate number of train in a minute is only 25 trains.
The map contain a mod to switch many trains in automatic mode so it's easy to copy a loop with already 12 trains but the refueling has to be manual so it can be better to reload the map when fuel is exhausted
In case it's unclear what is a traffic jam, there is a loop 4 with a bunch of them, this means there are several different area with trains completly still at any time not directly adjacent to each other, It is from the attempt to place signals 1 train distance away, but then there was not enough block, so i doubled and tripled the signal, and it's not just 1 big traffic jam but 2 or sometimes 3 trains that have 0 velocity at the same time, but trains in between them are moving.
Whereas on the loop 5 it is only 1 area where train completly still several trains adajcent to each other to the point where it's possible to see the traffic jam propagating backward compared to the traffic flow, when looking at the first velocity 0 train of the group of train stuck in the jam, it's a nice traffic jam to study
.
Additionnal note : There is no need to place the trains properly at first, they will naturally spread well to be have equal spacing and nice flow when they can, or will always create traffic jam when they can't, assuming the signal spacing due to curve rails is almost always going to be negligble. ( it's around 1 wagon worth of distance, who is going to realistically place signals closer than that and turn often enough that it matters ?). Other loops are easy to make to test.