Make production graphs cleaner

Post your ideas and suggestions how to improve the game.

Moderator: ickputzdirwech

Post Reply
coppercoil
Filter Inserter
Filter Inserter
Posts: 472
Joined: Tue Jun 26, 2018 10:14 am
Contact:

Make production graphs cleaner

Post by coppercoil »

TL;DR
Prod2Prod.png
Prod2Prod.png (63.38 KiB) Viewed 2183 times
What ?
1. Remove high frequencies in the graphs.
2. Make graph lines smooth.
Why ?
Graphs will be cleaner and nicer.

User avatar
valneq
Smart Inserter
Smart Inserter
Posts: 1150
Joined: Fri Jul 12, 2019 7:43 am
Contact:

Re: Make production graphs cleaner

Post by valneq »

thing to consider: smoothing out the graphs will remove details that can be very informative

Koub
Global Moderator
Global Moderator
Posts: 7199
Joined: Fri May 30, 2014 8:54 am
Contact:

Re: Make production graphs cleaner

Post by Koub »

Hands would be cleaner, nicer, and smoother looking without finger, but way less practical :mrgreen: .
Functionality >> Looks.
Graphs don't need to look nice, but to inform us what's going on in our factory.
Koub - Please consider English is not my native language.

coppercoil
Filter Inserter
Filter Inserter
Posts: 472
Joined: Tue Jun 26, 2018 10:14 am
Contact:

Re: Make production graphs cleaner

Post by coppercoil »

Just switch to shorter time scale for details. Large scale already hides short peaks, so smoothing would be not so "destructive" as you think. I mean, graphs hide fine details by now, and players are fine with that :)

foamy
Filter Inserter
Filter Inserter
Posts: 432
Joined: Mon Aug 26, 2019 4:14 am
Contact:

Re: Make production graphs cleaner

Post by foamy »

coppercoil wrote:
Wed Feb 03, 2021 9:55 pm
Just switch to shorter time scale for details. Large scale already hides short peaks, so smoothing would be not so "destructive" as you think. I mean, graphs hide fine details by now, and players are fine with that :)
Problem there is that you can't examine arbitrary segments at high resolution, just the most recent one. :(

pichutarius
Fast Inserter
Fast Inserter
Posts: 158
Joined: Mon Feb 27, 2017 12:47 am
Contact:

Re: Make production graphs cleaner

Post by pichutarius »

My guess, currently it counts how many of each item is produced x minutes ago, and divide by x. Bigger x for bigger timescale and vice versa.

From math perspective, I wonder how to implement smoothing, probably need convolution with bell curve, and therefore cost ups. Its not that easy.

User avatar
ickputzdirwech
Filter Inserter
Filter Inserter
Posts: 768
Joined: Sun May 07, 2017 10:16 am
Contact:

Re: Make production graphs cleaner

Post by ickputzdirwech »

The graphs are already smoothed. Anyone remember the old spiky fluid graphs?

Smoother graphs aren’t necessarily less functional. True they include less information. But if they have too many details it’s hard to interpret what they actually represent. Especially if you are interested in long time trends. I think I wouldn’t mind a bit more smoothing.
Mods: Shortcuts for 1.1, ick's Sea Block, ick's vanilla tweaks
Tools: Atom language pack
Text quickly seems cold and unfriendly. Be careful how you write and interpret what others have written.
- A reminder for me and all who read what I write

Koub
Global Moderator
Global Moderator
Posts: 7199
Joined: Fri May 30, 2014 8:54 am
Contact:

Re: Make production graphs cleaner

Post by Koub »

In that case, like in Excel charts, a feature "average over N points" with obviously possibility to set whatever N positive integer you'd like. Like that when "trend" needed, it's possible, when details needed, it's possible too.
Koub - Please consider English is not my native language.

User avatar
Taneeda
Long Handed Inserter
Posts: 59
Joined: Tue May 30, 2017 9:25 am
Contact:

Re: Make production graphs cleaner

Post by Taneeda »

+1

My first thought on this topic was "YES, please" :)
Koub wrote:
Thu Feb 04, 2021 7:07 am
In that case, like in Excel charts, a feature "average over N points" with obviously possibility to set whatever N positive integer you'd like. Like that when "trend" needed, it's possible, when details needed, it's possible too.
Why not add a slider to statistics panel to adjust N between 1..10, with default of 3? Same for electric stats panel...
Shit happens, don't worry, keep happy

User avatar
ssilk
Global Moderator
Global Moderator
Posts: 12888
Joined: Tue Apr 16, 2013 10:35 pm
Contact:

Re: Make production graphs cleaner

Post by ssilk »

Technically this is nothing else than a function that takes more ore less points in a time-frame of the graph and uses the average, instead of each single point. It looks like it is loosing information , but this is in practice used very often, for example to see, if values are rising or falling.

For example when we have the load of the CPU’s in a cluster, then both is very interesting: you want to see, if there are peaks in the load and you want to see a general trend of the load. The first is needed to find events that causes such peaks, and the second is used to see, when it is time to add a new node to the cluster.

But as the stats in Factorio are currently working I don’t see, how that might be useful. To make sense for that graph, you need to see both types side by side.
...

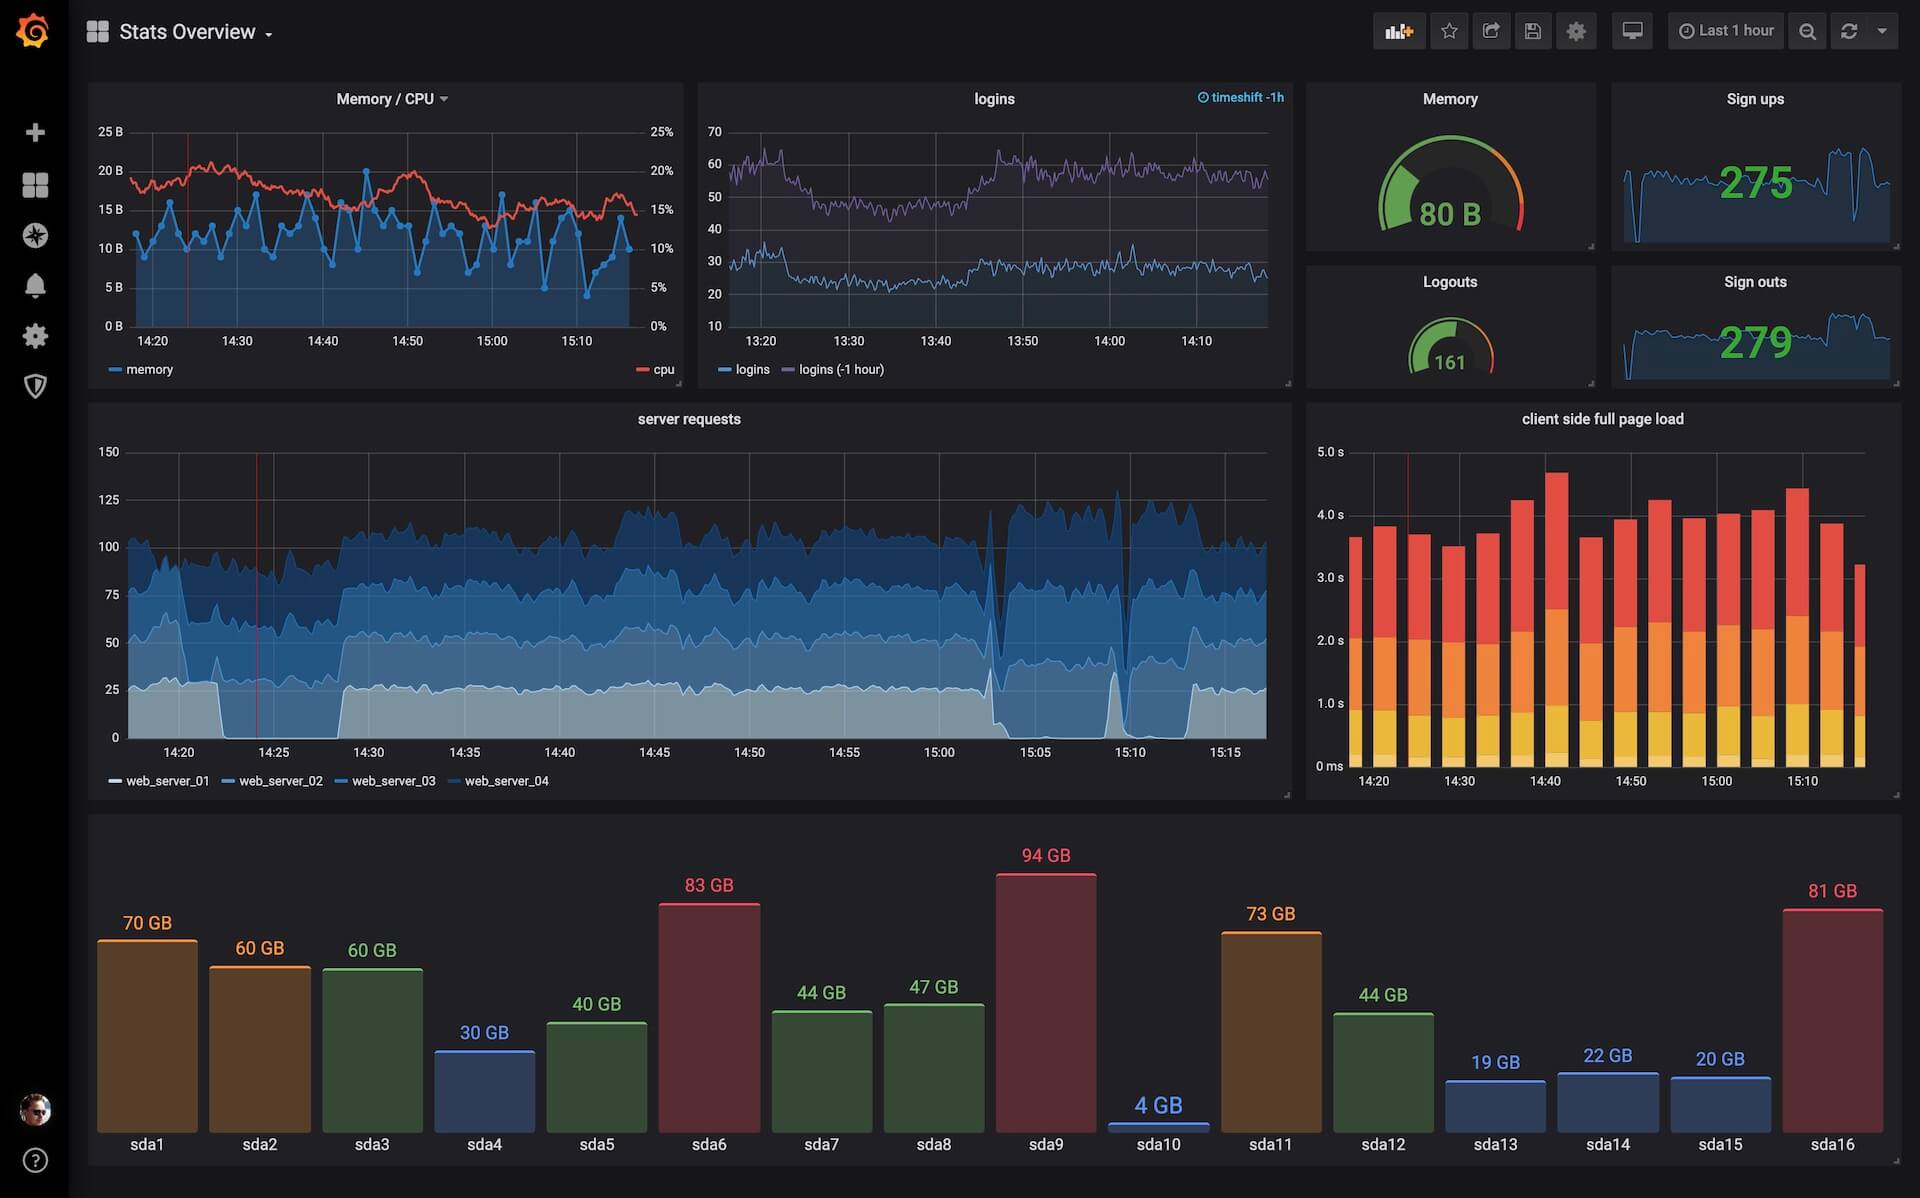
What I really would like to see here are free configurable dashboards. Like with Grafana.
Image

And I would be able to say: when power under x for n seconds raise alarm. Or when pollution is over x turn mines off. Just need to create a new dashboard, add the right values, the type of the graph, set alarms, ready.

But that would cost many cpu-cycles to create, would slow down Factorio significantly. I think we need to live with the current compromise. But I don’t like it. :)
Cool suggestion: Eatable MOUSE-pointers.
Have you used the Advanced Search today?
Need help, question? FAQ - Wiki - Forum help
I still like small signatures...

Post Reply

Return to “Ideas and Suggestions”