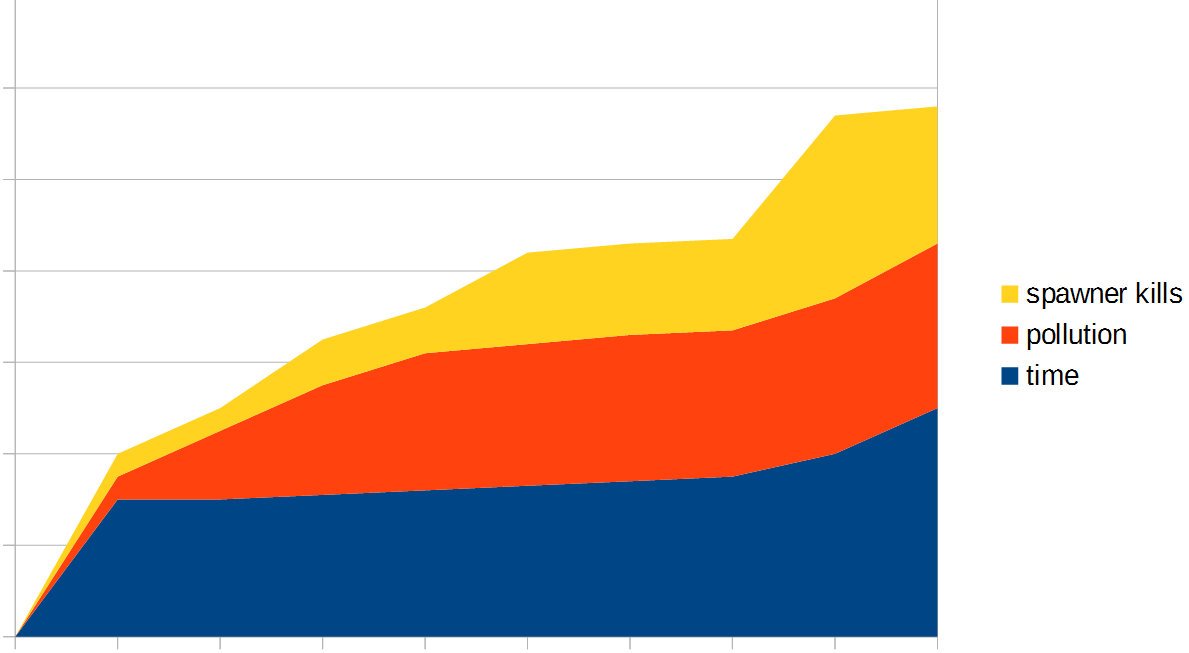
Evolution Diagram
Posted: Mon Mar 18, 2019 4:21 pm
TL;DR
I would like there being a graph for evolution.What ?
I would like to be able to open a graph for evolution. This should not only show the evolution factor over time but also the percentage of time, spawner kills and pollution that contributed to the evolution. A mock-up to show about how this could look (I left out the actual values on purpose as they wouldn't make sense in this context). The top of the yellow part doubles as the graph to show the whole evolution factor over time.
Why ?
I find the current solution of using a command to find out the evolution factor a little sloppy. It feels like the average player isn't supposed to know the evolution factor while you can find it out without penalty, but only if you know about the command.Also I would like to better be able to see in which time periods I produced the most or the least pollution and what contributed to it the most.
EDIT: Added a picture to show about how this would look