Lets talk production window, shall we? :)
Posted: Wed Feb 07, 2018 2:57 pm
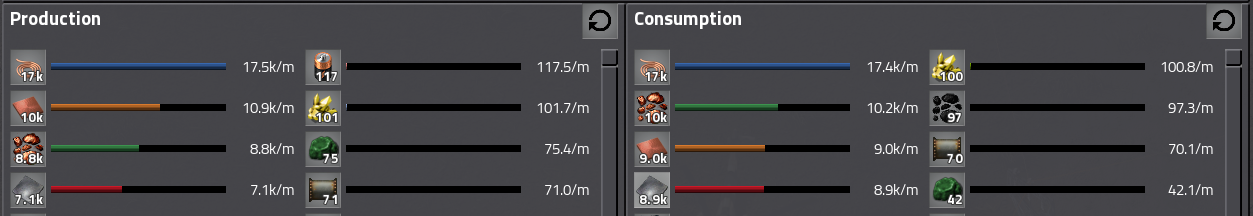
So this is a snippet of the production window as is. I like it. But i can't help to think the following:
Right now the absolute numbers behind each material will tell you how much of each material is produced.
It also tells you actually the ratio between each material that is produced.
For example, everybody can tell pretty fast that 8.8k/m coppper ore is around half of 17.5k/m copper cables of production.
Each colored bar also represents a ratio of production compared to the top material produced.
Which essentially gives you the same information as all the numbers but then in a different format.
For me, although the colored bars look nice, that means they feel kinda redundant.
On top of that, tracking the ratio compared to top production is for most people not useful often. (i think? don't wanna generalize, haha)
So what if each bar represents the efficiency at which that particular material can be produced? Taking all beacons and modules into consideration.
Lets say all your Electric Circuit (green chips) factories have a combined output of 4K/m.
But they only produce half of that because ... lets say copper is running out, can be anything really.
You would instantly see your electric circuit factories are running at half the effiency for whatever reason.
This would also help tremendous in pinpointing what your factory needs,
one look at the production window and you can see which productions lines are running at max capacity
and whom therefor needs an upgrade the earliest.
For really well optimized factories all the colored bars would be 90/100% maxed out and would also be a direct indication on how well the factory is designed and functioning.
(wouldn't that be so cool??) (don't all start posting your super efficiency bases on the forums
At last:
Thanks for an amazing game Wube and the dev team!