Alright, I'm back! Sorry for the delay, had to put this project on hold for a while. But, I'm back with processed data, so we can enjoy some pointless numbers and graphs.
Measurements
I collected a few datasets in total concerning flow speed through pipes. For every pipe length setup includes
pump -> n x pipe -> pump
Fluid (water) is teleported right into the first pump (source) and removed from the last pump (sink). Removed values are recorded and reported as factual amount of flow that happened on specific tick. A single dataset includes all lengths from 1 to 1000. Each test runs for 60000 ticks.
There are 6 datasets in total: 4 with forward build order (i.e. joint evaluation happens along the flow), but each facing a different direction (east, north, west and south respectively) and 2 more datasets facing east, one with backward build order (i.e. joint evaluation happens against the flow) and one more with random build order.
Tests
All tests are variations of
Student's t-tests.
First, I wanted to test influence of direction to take it out of picture, but then halfway through I remembered that both direction and build order only influence joint evaluation order. We can already test effects of joint evaluation order by tweaking build order, so there is no need to test direction... But I still did it. This verifies absence of any difference
inherent to joint orientation.
The test was performed pairwise on first 4 datasets. Because they have identical joint evaluation order the expectation that behaviour should be same.
The result? Datasets are not simply close but about as identical as we can make it. Yeah, I know it is paranoid to test this, but now we can 100% confirm that orientation doesn't affect anything.
Second, I took all datasets facing east. There three of them differing by build order: forward, backward and random. Those were compared against the theoretically calculated max flow value.
The result - all OK. Actually, the resulting values are clustered around expected mean
very tightly, so we can be quite confident in this result.
Third, I ran pairwise tests on those same datasets. This is were things get interesting, because we get discrepancies! To be honest I expected something like this to happen, the surprise was that it happened so early, forward and backward sets disagree already on lengths 8 and above.
To clarify, this test verifies that two sets of data are kinda equivalent in statistical sense, and this is what really is disproven. All three define mean in a way compatible with the theory (as seen in the second test), so there is a different cause behind it. Indeed, we subtly break a whole bunch of assumptions required for validity of such test. One of those is on the surface: it assumed that individual flow measurements are independent from each other (and equally characterize the value that we want to find - max flow throughput). However this is not the case! We can make this assumption for values which are measured after flow converged, but for the values at the start this is clearly not true.
From practical perspective this is rarely an issue. If your dataset is large enough having a few bad measurements doesn't change anything. And in case it does we can either take more measurements, or filter out bad ones.
To prove the point we can discard first few measurements - we know those are at fault. And indeed, this makes more line length to agree. For example, throwing away first 59000 values now causes only length of 127 or above to disagree.
There isn't much we can take out of this case. Probably the only useful result - convergence speed is
very sensitive to length.
Graphs
Since we have all flow values from the very start, we can try to estimate how much time it takes for a given line to converge to its target value. In order to do that we calculate theoretical
max_flow value and set an
offset and say that any values that fall into
[max_flow - offset; max_flow+offset] interval have converged. Time to converge is basically the last tick with value outside of this range.
With this we can graph convergence time for different build orders, let's say with 0.01 offset - it is about where human will stop noticing differences.
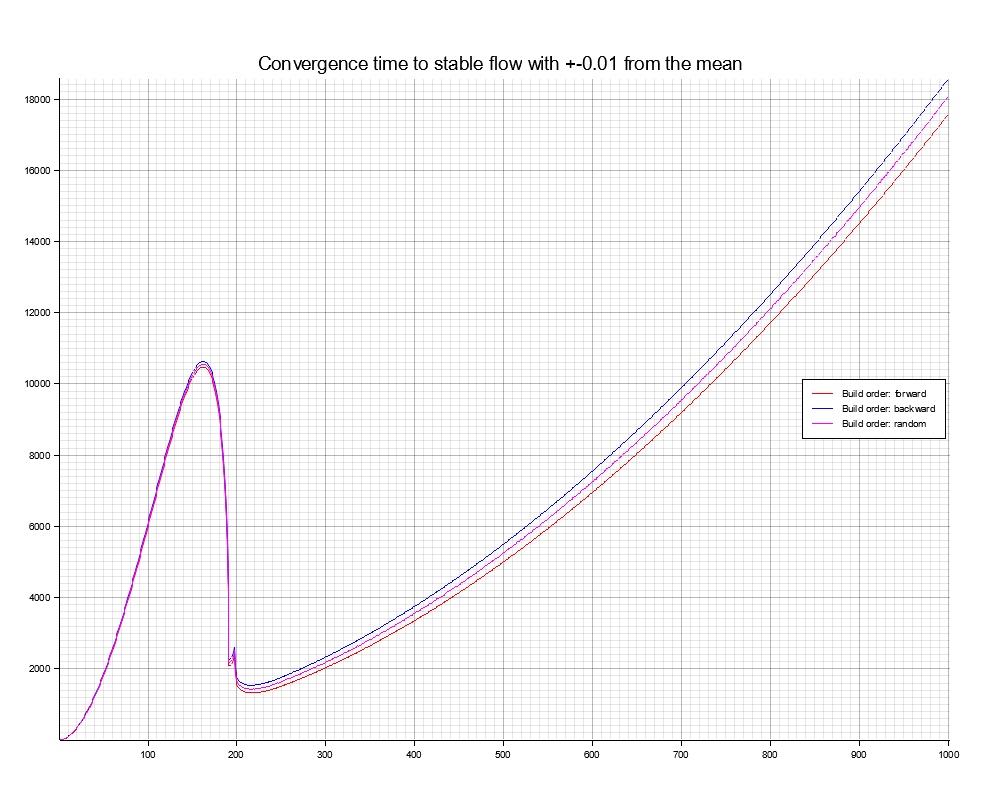
- pipeline_convergence_time_0.01.png (57.89 KiB) Viewed 3551 times
Now this is damn wild. Notch around 200 should be recognizable - this is our old friend 197. At 197 there is a switch to a different formula which apparently strongly affects convergence speed. It also looks as if convergence slows down significantly before this point:
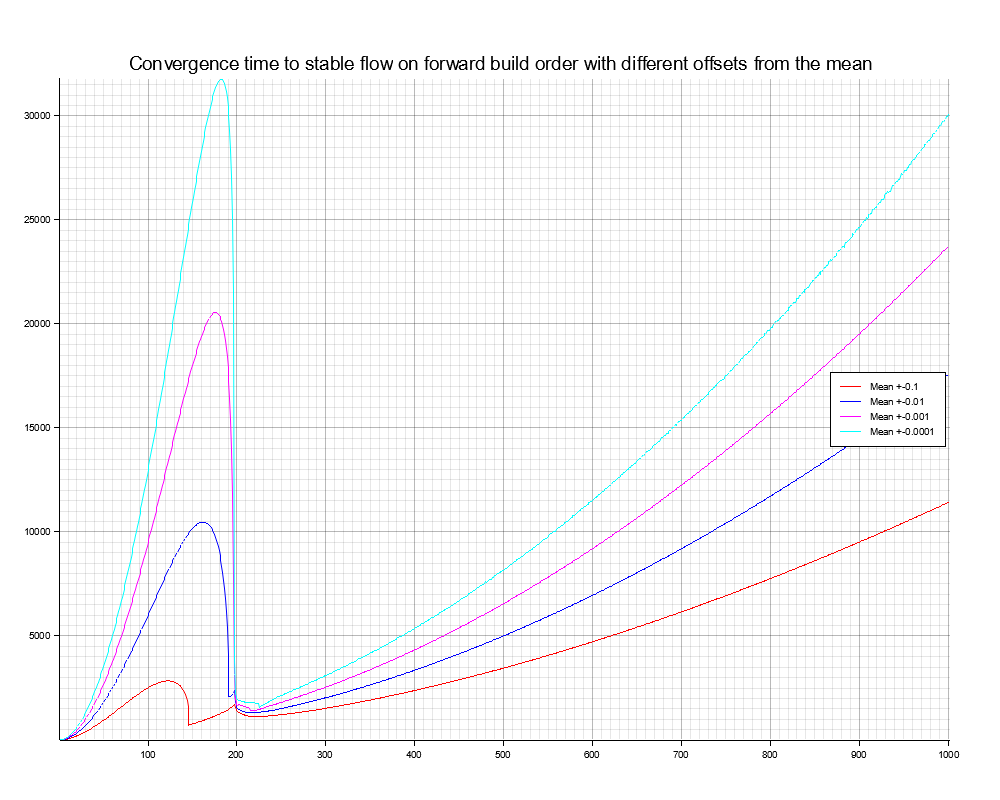
- pipeline_convergence_time_different_offsets.png (62.92 KiB) Viewed 3551 times
I'm not sure what causes that notch around 150-ish for 0.1 offset. I also couldn't add precision lower that 10^-4, theoretical mean calculations are not coded accurately enough for this.
Last, I though it would be interesting to see the difference in convergence times between fastest and slowest (to converge) build order:
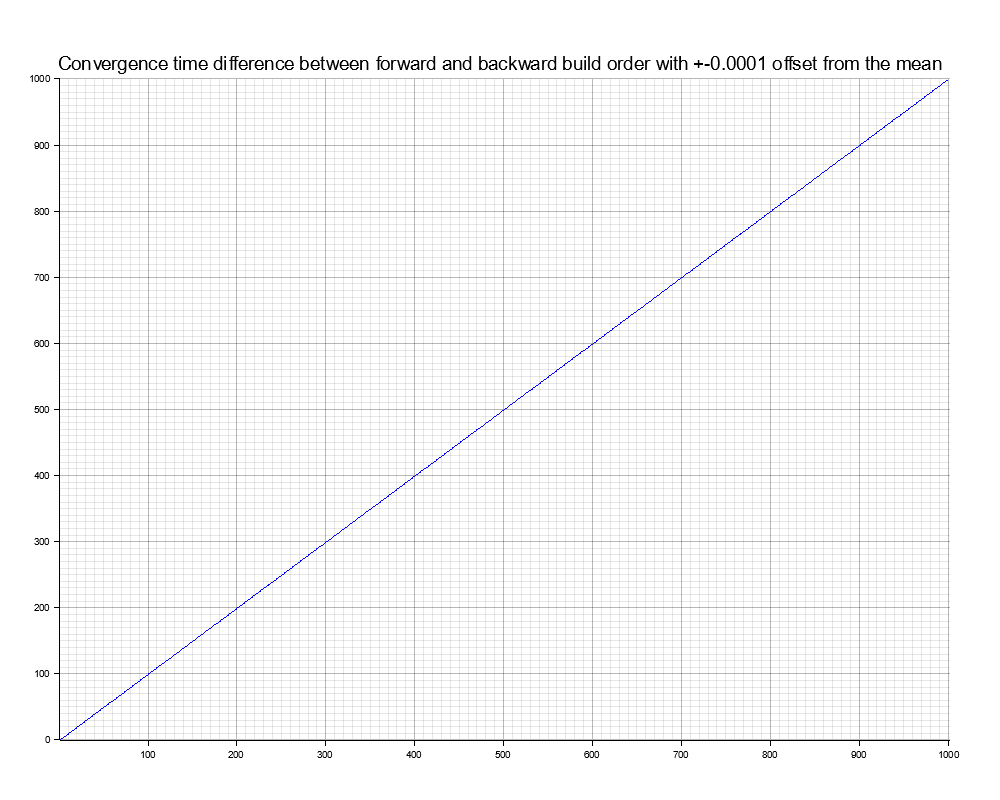
- pipeline_convergence_time_difference_0.0001.png (43.05 KiB) Viewed 3551 times
No, this graph is not a joke. Despite the craziness above, this one is just a line.
Even before I started to make those graphs I made a prediction that the difference between the two will scale linearly with length, and actually if length is
n then the difference will be approximately
n.
Lo and behold! It feels nice to be correct from time to time.
The explanation behind this phenomenon is kinda weird. Establishing flow in a pipeline is a balance act between two elements: source and sink. They have to move in tandem and in the end the flow measured at each must coincide.
However, if they are out of balance (like at the very start) they need to "communicate" somehow in order to tune respective input and output flow. The only way it can happen is by adjusting fluid levels (or, equivalently, pressure) and let that propagate through the line to the other end. More than that, we are also waiting for the feedback from the other side in order to know whether flow increase/decrease is justified and whether it can continue. In a way there is a feedback loop where source (or sink) constantly adjusts flow through it and then waits for the information from the other side.
The interesting question is how long such feedback loops are? For a forward build order change in source propagated to sink in one tick, however it takes
n - 1 (that is number of joints) to travel back for a total of
n ticks. For a backward build order change in source reaches sink in
n - 1 tick, but travels back in only 1 tick for a total of
n ticks too! It is also sensible to say that convergence time scales with
n and rate of change is likely roughly equivalent in both cases.
Then, if two cases are so similar, why do we observe the difference? The answer is starting conditions. This is correct that sources in both cases start their respective feedback loops immediately, at tick 0. However, situation with sink is different. For a forward build order, sink learns about existence of source on tick 1, but for a backward order, fluid reaches sink only on tick
n!
So, forward build order simply gets a head start of exactly
n - 1 ticks - and this is what we observed on the last graph.
By the way it also explains why forward build is the fastest (it takes shortest amount of time for fluid to reach sink) and backward build is the slowest (it takes the longest amount of time to reach sink). Also, from practical perspective, difference is negligible. For a line of length
n difference in convergence time between fastest and slowest will always be about
n ticks and it is dwarfed by total time required for convergence even to 0.01 precision.
I'm getting a bit off track here, but I hope you noticed something interesting. I described that in the process of convergence source can create a pressure differential which propagates to sink and back. Does it remind you of something? Waves! Indeed Factorio fluidboxes satisfy one of the key conditions for their existence: locality. Fluidboxes only affect "nearby" fluidboxes (for whatever definition of "nearby" we use here).
Following this thought, for fluidboxes as medium we can also define a "speed of information". This usually refers to speed of light from relativity, but it also known in other fields too, for example in fluid dynamics it is known as speed of sound. Or in other words it is speed of wave propagation.
Our case is rather interesting because in Factorio fluids "speed of sound" is variable! Actually it heavily depends on build order and changes depending on direction. For example, for backward build, "speed of sound" is 1 fluidbox/tick along the flow, but against the flow it is effectively infinite!
By the way this isn't non-physical or anything. For example, when we talk about speed of light we talk about "back-and-forth" speed of light, e.g. measured from A -> B -> A, and then we assume that it is equal in all directions. It is impossible to measure unidirectional speed of light (at least within the confines of the theory). This opens door for fringe possibilities. Theoretically it is possible that speed of light depends on direction, and yes this includes the case where it is
c/2 in one direction and infinite in the opposite one (although such result will require us to rethink a bunch other theories like big bang). I thought this is just a really interesting parallel.