Page 1 of 1
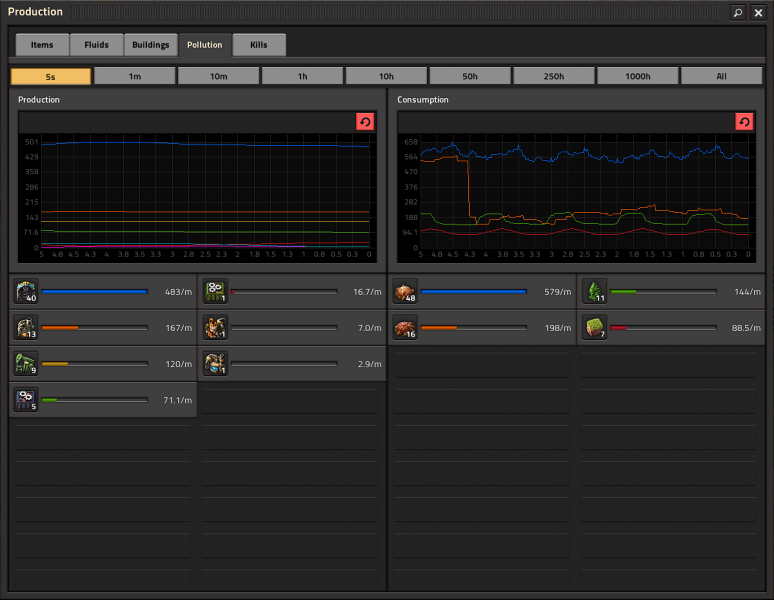
production tab
Posted: Mon Oct 31, 2022 7:07 am
by JimBarracus
Is it possible to see the total pollution generated over time?
All I can see are the entities like miners etc.
I would like to see them added up in a single graph.
A stacked bar chart would work

Same applies to electrcity.
Re: production tab
Posted: Mon Oct 31, 2022 2:03 pm
by FuryoftheStars
Not that I know of, though I think this suggestion (and ssilk I believe links to more later in that thread) is kind of what you are looking for?
viewtopic.php?f=6&t=103565
Re: production tab
Posted: Tue Nov 01, 2022 7:47 am
by JimBarracus
Thanks I was thinking about something like that.
I dont think this will get implemented.
Re: production tab
Posted: Tue Nov 01, 2022 8:18 am
by Stringweasel
It's possible to do this with a mod

Re: production tab
Posted: Tue Nov 01, 2022 1:57 pm
by gGeorg
Stringweasel wrote: Tue Nov 01, 2022 8:18 am
It's possible to do this with a mod
Which one ?
I hope improved stats will be part of The Expansion.
I also would like to see better sorting of items, in this chart you want to see most significant items first, but it is not supported.
There are two columns, so the second column( the right side column, a half of the area) shows some very insignificant items.
Re: production tab
Posted: Tue Nov 01, 2022 2:38 pm
by Stringweasel
gGeorg wrote: Tue Nov 01, 2022 1:57 pm
Which one ?
The stacked bar chart. At least the information is accessable. How to display it on screen is a different can of worms.